. 2014 Nov 26;6(1):47.
doi: 10.1186/s13321-014-0047-1. eCollection 2014.

Reliable estimation of prediction errors for QSAR models under model uncertainty using double cross-validation

Affiliations

Reliable estimation of prediction errors for QSAR models under model uncertainty using double cross-validation

Désirée Baumann et al. J Cheminform. .

Abstract

Background: Generally, QSAR modelling requires both model selection and validation since there is no a priori knowledge about the optimal QSAR model. Prediction errors (PE) are frequently used to select and to assess the models under study. Reliable estimation of prediction errors is challenging - especially under model uncertainty - and requires independent test objects. These test objects must not be involved in model building nor in model selection. Double cross-validation, sometimes also termed nested cross-validation, offers an attractive possibility to generate test data and to select QSAR models since it uses the data very efficiently. Nevertheless, there is a controversy in the literature with respect to the reliability of double cross-validation under model uncertainty. Moreover, systematic studies investigating the adequate parameterization of double cross-validation are still missing. Here, the cross-validation design in the inner loop and the influence of the test set size in the outer loop is systematically studied for regression models in combination with variable selection.

Methods: Simulated and real data are analysed with double cross-validation to identify important factors for the resulting model quality. For the simulated data, a bias-variance decomposition is provided.

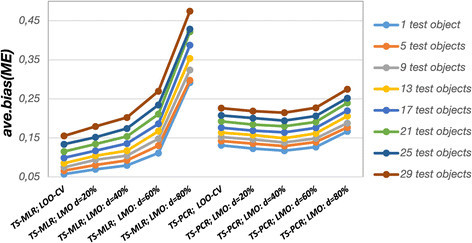
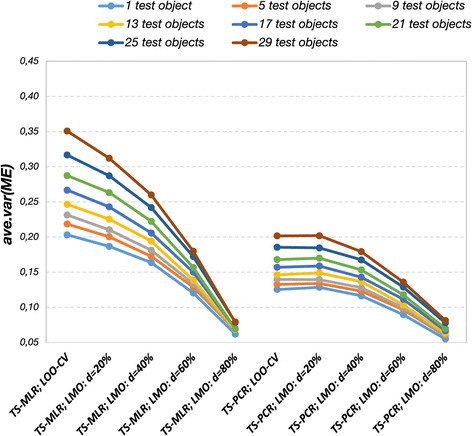
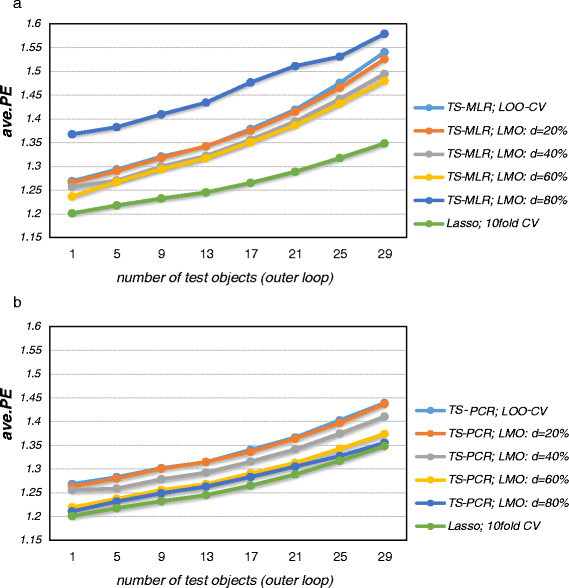
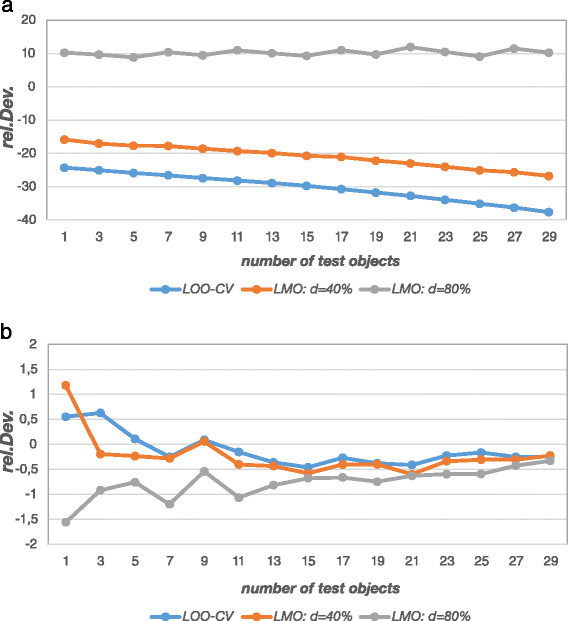
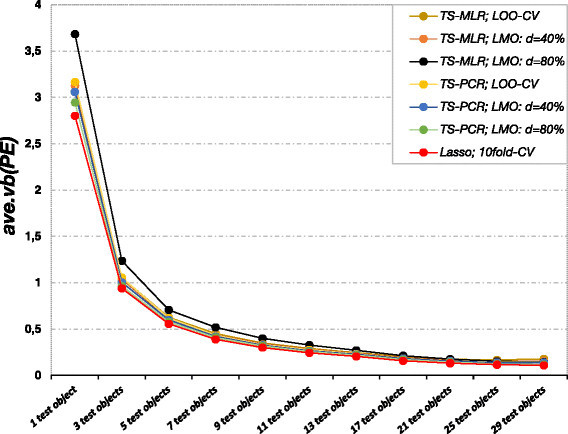
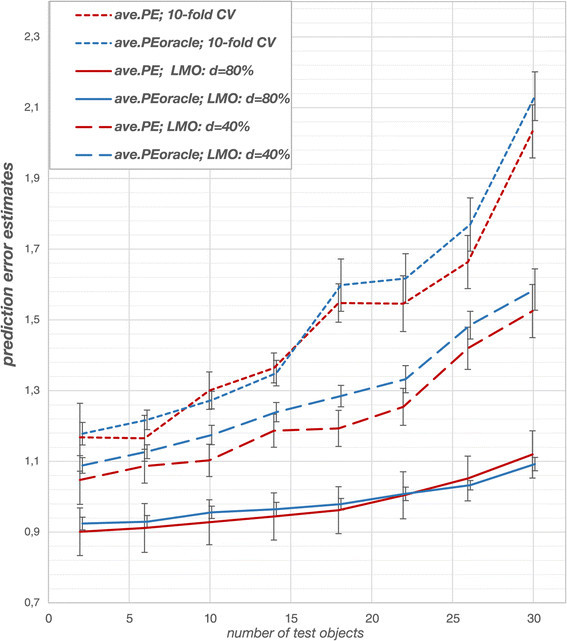
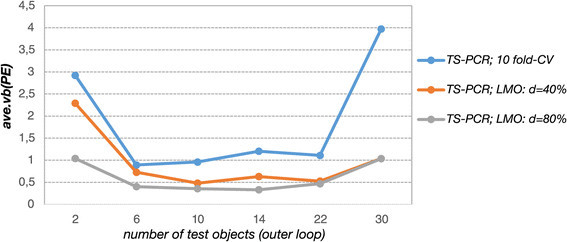
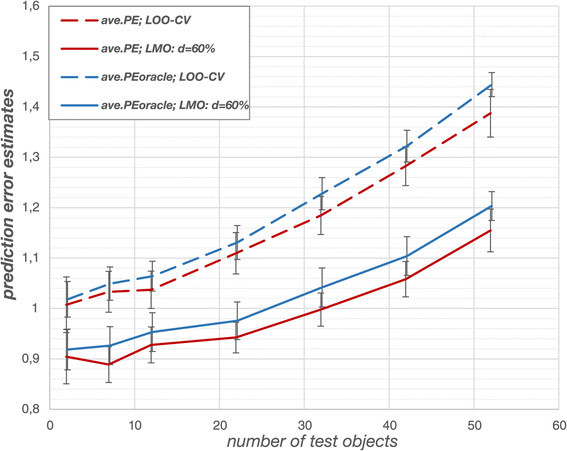
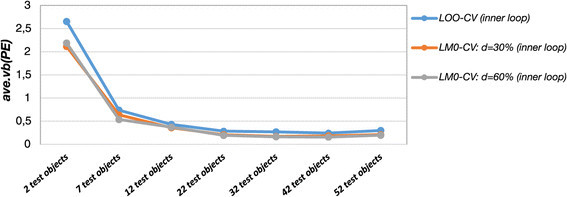
Results: The prediction errors of QSAR/QSPR regression models in combination with variable selection depend to a large degree on the parameterization of double cross-validation. While the parameters for the inner loop of double cross-validation mainly influence bias and variance of the resulting models, the parameters for the outer loop mainly influence the variability of the resulting prediction error estimate.

Conclusions: Double cross-validation reliably and unbiasedly estimates prediction errors under model uncertainty for regression models. As compared to a single test set, double cross-validation provided a more realistic picture of model quality and should be preferred over a single test set.

Keywords: Cross-validation; Double cross-validation; External validation; Internal validation; Prediction error; Regression.


Figures

Figure 1
Figure 1
Bias terms (TS-MLR, TS-PCR, simulation model 2). Average bias terms of the model errors (ave.bias (ME )) for simulation model 2. The bias varies depending on the regression technique (TS-MLR, TS-PCR), different cross-validation designs in the inner loop, and test set size in the outer loop.
Figure 2
Figure 2
Variance terms (TS-MLR, TS-PCR, simulation model 2). Average variance terms of the model errors (ave.var (ME )) for simulation model 2. Variance also strongly depends on the regression technique (TS-MLR, TS-PCR), cross-validation design in the inner loop, and test set size in the outer loop.
Figure 3
Figure 3
Prediction errors of the outer loop (simulation model 2). Average prediction errors (ave.PE , outer loop) for simulation model 2. TS-MLR (Figure a) performs worse than TS-PCR (Figure b), particularly so for small training sets (i.e. large test sets). Cross-validation design also influences the magnitude of the prediction error. Lasso performs best in simulation model 2.
Figure 4
Figure 4
a-b - Relative deviation of prediction error estimates (TS-PCR, simulation model 2). Figure a shows that prediction error estimates from the inner loop of double cross-validation (ave.PE internal) deviate heavily from the theoretical prediction error (ave.PE theo) owing to model selection bias (downward bias) and sample size effects (upward bias for smaller construction sets). Prediction error estimates from the outer loop (ave.PE ) slightly deviate for small test sets while they converge to the theoretical prediction error for larger test sets (Figure b).
Figure 5
Figure 5
Variability of the error estimates (outer loop, simulation model 2). The variability of the prediction error estimates from the outer loop (ave.vb (PE )) quickly decreases for larger test sets. The variable selection algorithm in the inner loop (Lasso, TS-MR and TS-PCR) and the cross-validation design have a smaller impact.
Figure 6
Figure 6
Solubility data: prediction error estimates for TS-PCR. For the solubility data, prediction error estimates from the outer loop agree with those obtained from the ‘oracle’ data. Deviations are attributed to random fluctuations (see standard deviations). Cross-validation design influences the performance of the derived models. Stringent CV -80% performs best while 10-fold CV performs worst because it overfits the data. The error estimates are averaged over 6 different partitions into ‘oracle’ data and data sample). Naturally, prediction errors increase for smaller training sets (i.e. larger test sets).
Figure 7
Figure 7
Solubility data: Variability of the prediction error estimates. Variability of the error estimates derived from the outer loop of double cross-validation (ave.vb (PE )) for different test data set sizes in the outer loop and for TS-PCR with different cross-validation designs in the inner loop (10-fold CV, CV -40% and CV -80%). Moderately sized test sets show the smallest variability.
Figure 8
Figure 8
Artemisinin data: prediction error estimates for SA-kNN. In case of the artemisinin data, prediction error estimates from the outer loop again agree with those obtained from the comparatively small ‘oracle’ data set. However, all prediction errors underestimate the values obtained with the ‘oracle’. Since standard deviations are large, the deviations are attributed to random fluctuations. Stringent cross-validation schemes outperform LOO-CV. The prediction error estimates are averaged over 15 different partitions into ‘oracle’ data and data sample.
Figure 9
Figure 9
Artemisinin data: Variability of the prediction error estimates. Variability of the error estimates derived from the outer loop (ave.vb (PE )) for different test data set sizes in the outer loop and for SA-kNN in combination with different cross-validation techniques in the inner loop (LOO-CV, CV -30% and CV -60%). Variability quickly decreases with increasing test set size.

References

    1. Kubinyi H. QSAR and 3D QSAR in drug design. Part 1: methodology. Drug Discov Today. 1997;2:457–467. doi: 10.1016/S1359-6446(97)01079-9. - DOI
    1. Baumann K. Cross-validation as the objective function of variable selection. Trends Anal Chem. 2003;22:395–406. doi: 10.1016/S0165-9936(03)00607-1. - DOI
    1. Todeschini R, Consonni V. Handbook of Molecular Descriptors. Berlin: Wiley-VCH; 2002.
    1. Hastie T, Tibshirani R, Friedmann J. Elements of statistical Learning: Data Mining, Inference and Prediction. 2. New York: Springer; 2009.
    1. Mosteller F, Turkey J. Data Analysis, Including Statistics. In: Gardner L, Eliot A, editors. The Handbook of Social Psychology. 2. Springer: Addison-Wesley, Reading, MA, USA; 1968. pp. 109–112.

LinkOut - more resources