

The ω6-fatty acid, arachidonic acid, regulates the conversion of white to brite adipocyte through a prostaglandin/calcium mediated pathway
- PMID: 25506549
- PMCID: PMC4264041
- DOI: 10.1016/j.molmet.2014.09.003
The ω6-fatty acid, arachidonic acid, regulates the conversion of white to brite adipocyte through a prostaglandin/calcium mediated pathway
Abstract
Objective: Brite adipocytes are inducible energy-dissipating cells expressing UCP1 which appear within white adipose tissue of healthy adult individuals. Recruitment of these cells represents a potential strategy to fight obesity and associated diseases.
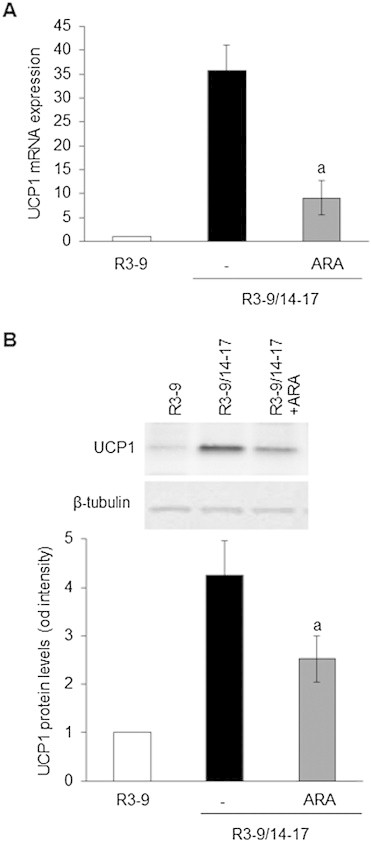
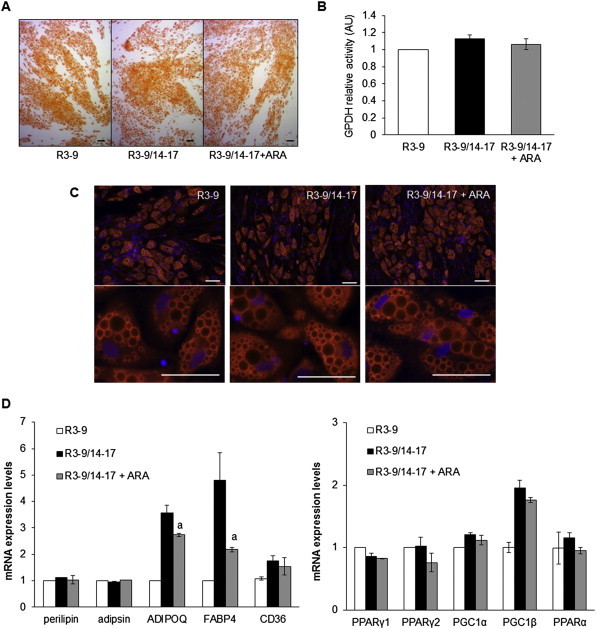
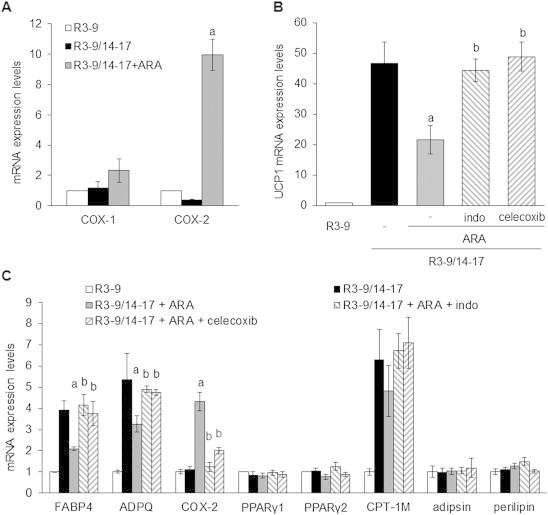
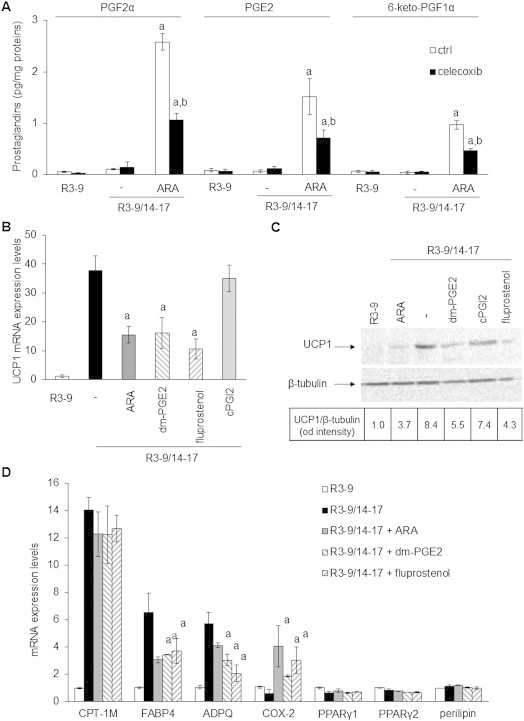
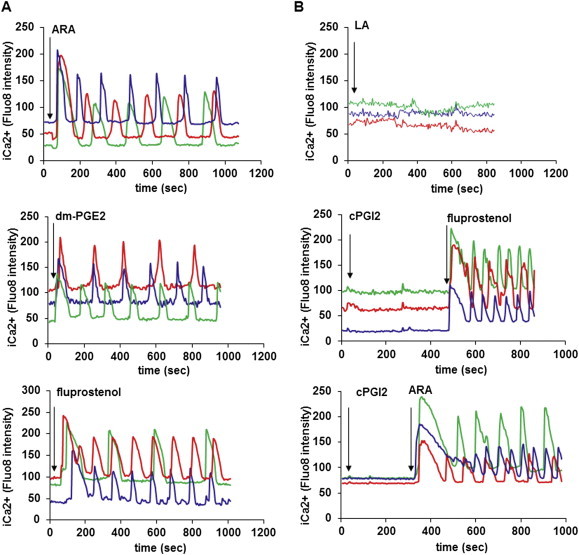
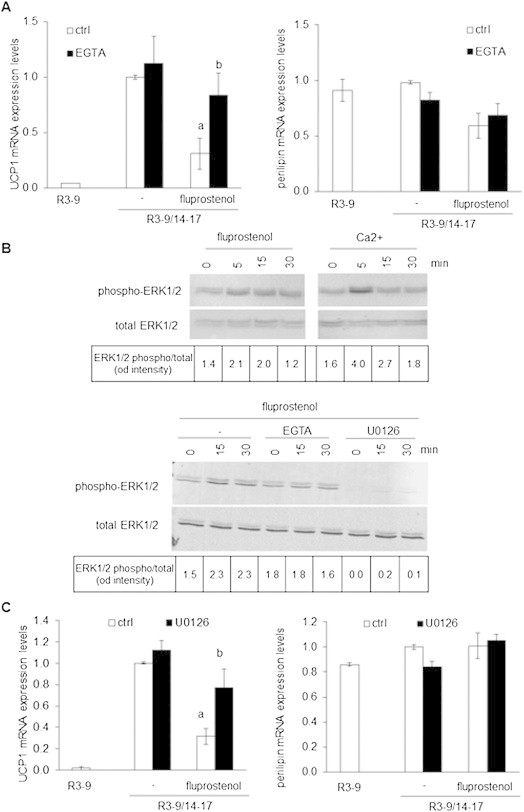
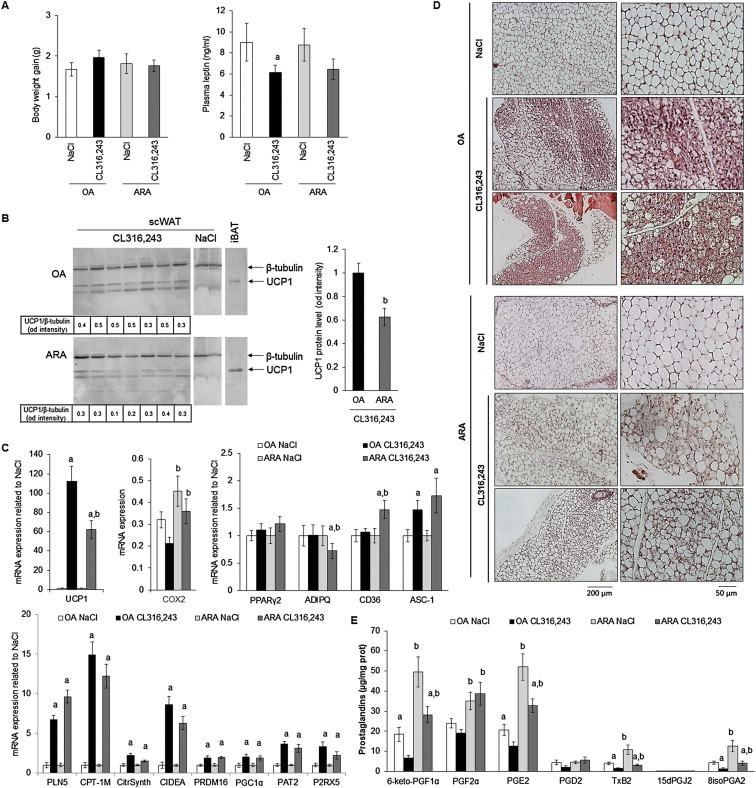
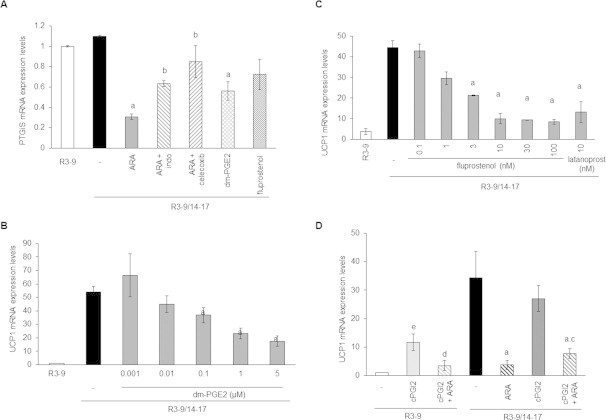
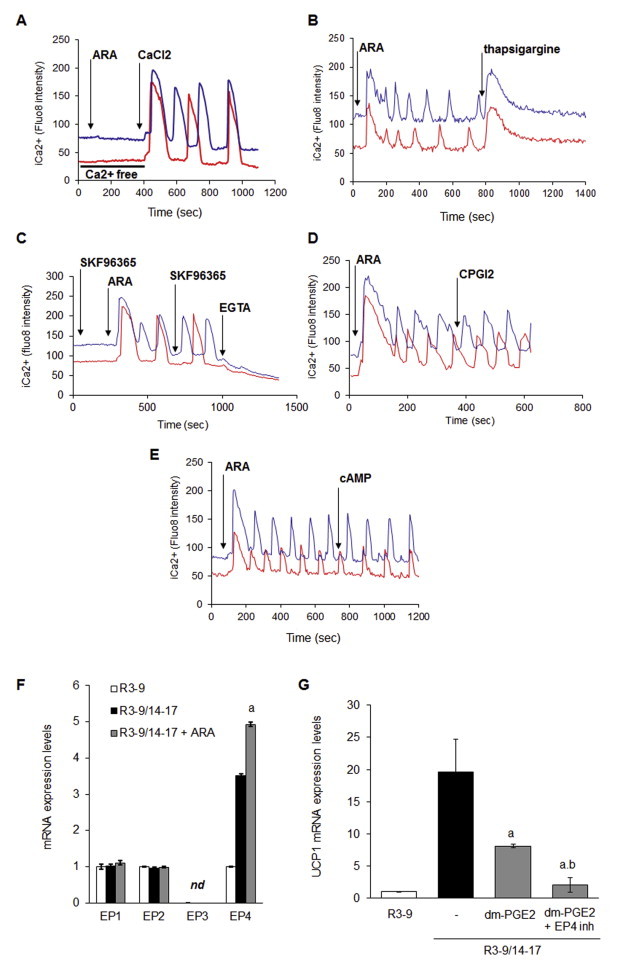
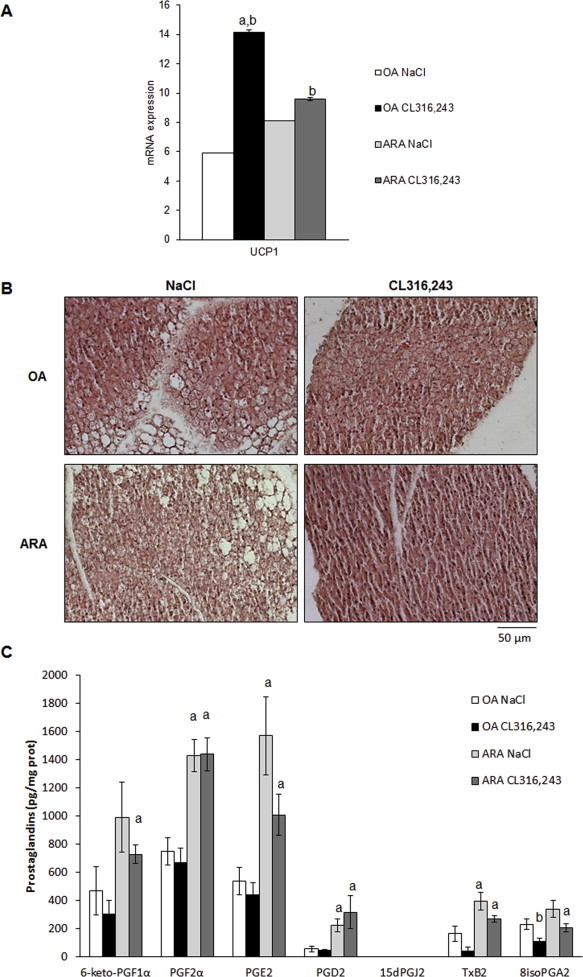
Methods/results: Using human Multipotent Adipose-Derived Stem cells, able to convert into brite adipocytes, we show that arachidonic acid strongly inhibits brite adipocyte formation via a cyclooxygenase pathway leading to secretion of PGE2 and PGF2α. Both prostaglandins induce an oscillatory Ca(++) signaling coupled to ERK pathway and trigger a decrease in UCP1 expression and in oxygen consumption without altering mitochondriogenesis. In mice fed a standard diet supplemented with ω6 arachidonic acid, PGF2α and PGE2 amounts are increased in subcutaneous white adipose tissue and associated with a decrease in the recruitment of brite adipocytes.
Conclusion: Our results suggest that dietary excess of ω6 polyunsaturated fatty acids present in Western diets, may also favor obesity by preventing the "browning" process to take place.
Keywords: Calcium oscillation; PGE2; PGF2α; PGI2; Polyunsaturated fatty acids; UCP1.
Figures

Similar articles
-
IP-receptor and PPARs trigger the conversion of human white to brite adipocyte induced by carbaprostacyclin.Biochim Biophys Acta. 2016 Apr;1861(4):285-93. doi: 10.1016/j.bbalip.2016.01.007. Epub 2016 Jan 14. Biochim Biophys Acta. 2016. PMID: 26775637
-
Impact of dietary ω3 polyunsaturated fatty acid supplementation on brown and brite adipocyte function.J Lipid Res. 2018 Mar;59(3):452-461. doi: 10.1194/jlr.M081091. Epub 2018 Jan 17. J Lipid Res. 2018. PMID: 29343538 Free PMC article.
-
White-to-brite conversion in human adipocytes promotes metabolic reprogramming towards fatty acid anabolic and catabolic pathways.Mol Metab. 2016 Mar 18;5(5):352-365. doi: 10.1016/j.molmet.2016.03.002. eCollection 2016 May. Mol Metab. 2016. PMID: 27110487 Free PMC article.
-
Meaningful respirometric measurements of UCP1-mediated thermogenesis.Biochimie. 2017 Mar;134:56-61. doi: 10.1016/j.biochi.2016.12.005. Epub 2016 Dec 14. Biochimie. 2017. PMID: 27986537 Review.
-
White, brown, beige/brite: different adipose cells for different functions?Endocrinology. 2013 Sep;154(9):2992-3000. doi: 10.1210/en.2013-1403. Epub 2013 Jun 19. Endocrinology. 2013. PMID: 23782940 Review.
Cited by
-
A compendium of G-protein-coupled receptors and cyclic nucleotide regulation of adipose tissue metabolism and energy expenditure.Clin Sci (Lond). 2020 Mar 13;134(5):473-512. doi: 10.1042/CS20190579. Clin Sci (Lond). 2020. PMID: 32149342 Free PMC article. Review.
-
A Novel Selective Inhibitor of Delta-5 Desaturase Lowers Insulin Resistance and Reduces Body Weight in Diet-Induced Obese C57BL/6J Mice.PLoS One. 2016 Nov 10;11(11):e0166198. doi: 10.1371/journal.pone.0166198. eCollection 2016. PLoS One. 2016. PMID: 27832159 Free PMC article.
-
Regulation of Adipose Tissue Biology by Long-Chain Fatty Acids: Metabolic Effects and Molecular Mechanisms.J Obes Metab Syndr. 2022 Jun 30;31(2):147-160. doi: 10.7570/jomes22014. Epub 2022 Jun 13. J Obes Metab Syndr. 2022. PMID: 35691686 Free PMC article. Review.
-
Dietary oleic acid drives obesogenic adipogenesis via modulation of LXRα signaling.Cell Rep. 2025 Apr 22;44(4):115527. doi: 10.1016/j.celrep.2025.115527. Epub 2025 Apr 11. Cell Rep. 2025. PMID: 40208790 Free PMC article.
-
Development, activation, and therapeutic potential of thermogenic adipocytes.Biochim Biophys Acta Mol Cell Biol Lipids. 2019 Jan;1864(1):13-19. doi: 10.1016/j.bbalip.2018.05.004. Epub 2018 May 22. Biochim Biophys Acta Mol Cell Biol Lipids. 2019. PMID: 29763732 Free PMC article. Review.
References
-
- Cannon B., Nedergaard J. Brown adipose tissue: function and physiological significance. Physiological Reviews. 2004;84:277–359. - PubMed
-
- Feldmann H.M., Golozoubova V., Cannon B., Nedergaard J. UCP1 ablation induces obesity and abolishes diet-induced thermogenesis in mice exempt from thermal stress by living at thermoneutrality. Cell Metabolism. 2009;9:203–209. - PubMed
-
- Petrovic N., Walden T.B., Shabalina I.G., Timmons J.A., Cannon B., Nedergaard J. Chronic peroxisome proliferator-activated receptor gamma (PPARgamma) activation of epididymally derived white adipocyte cultures reveals a population of thermogenically competent, UCP1-containing adipocytes molecularly distinct from classic brown adipocytes. Journal of Biological Chemistry. 2010;285:7153–7164. - PMC - PubMed
LinkOut - more resources
Full Text Sources
Other Literature Sources
Miscellaneous
