

doi: 10.1007/978-3-642-33555-6_7.
Mixed-Effects Shape Models for Estimating Longitudinal Changes in Anatomy
Affiliations
- PMID: 25506622
- PMCID: PMC4262964
- DOI: 10.1007/978-3-642-33555-6_7
Item in Clipboard
Mixed-Effects Shape Models for Estimating Longitudinal Changes in Anatomy
Spatiotemporal Image Anal Longitud Time Ser Image Data (2012).
2012 Oct.
Abstract
In this paper, we propose a new method for longitudinal shape analysis that fits a linear mixed-effects model, while simultaneously optimizing correspondences on a set of anatomical shapes. Shape changes are modeled in a hierarchical fashion, with the global population trend as a fixed effect and individual trends as random effects. The statistical significance of the estimated trends are evaluated using specifically designed permutation tests. We also develop a permutation test based on the Hotelling T2 statistic to compare the average shapes trends between two populations. We demonstrate the benefits of our method on a synthetic example of longitudinal tori and data from a developmental neuroimaging study.
Figures
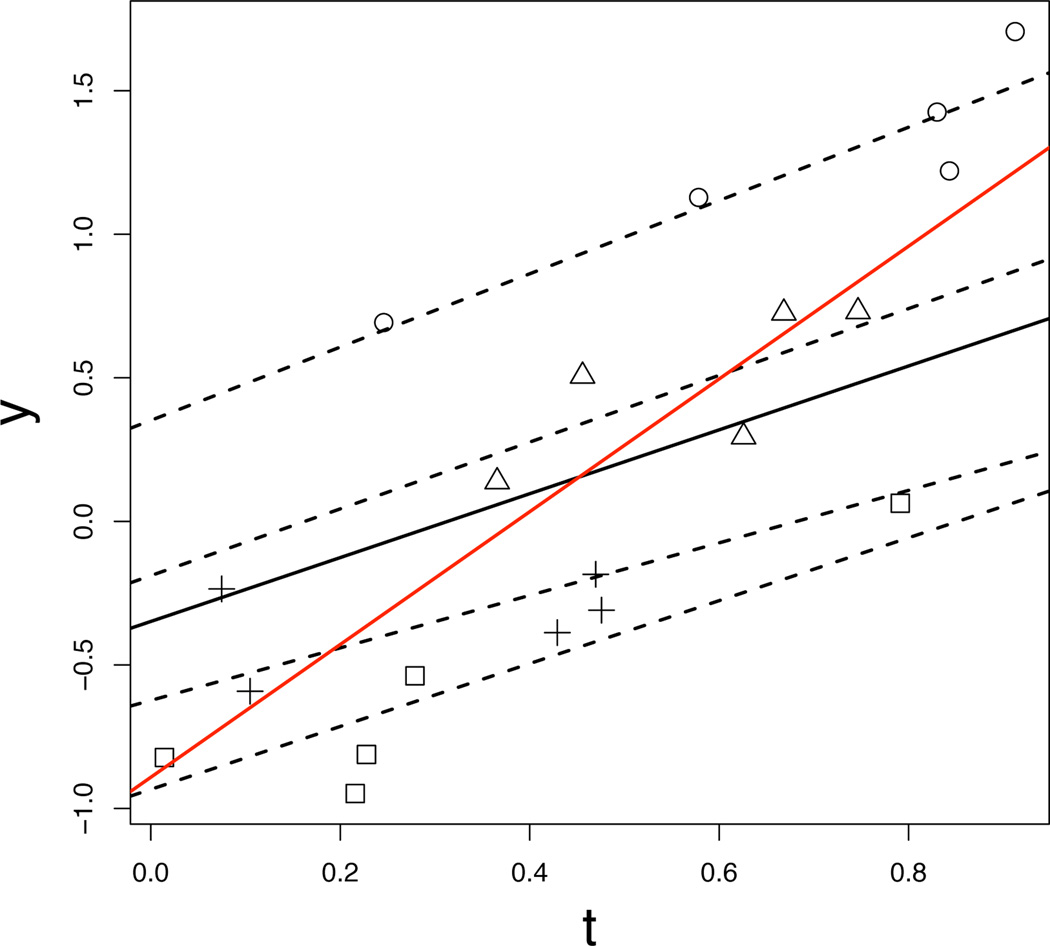
Example of randomly-generated, synthetic longitudinal data. Data points for each “individual” are displayed with different symbols. The estimated mixed-effects model is shown with both the fixed effects, i.e., group trend (solid black line), and random effects, i.e., individual trends (dashed lines). The estimated linear regression model, which ignores correlations within individuals, is shown as a red line.
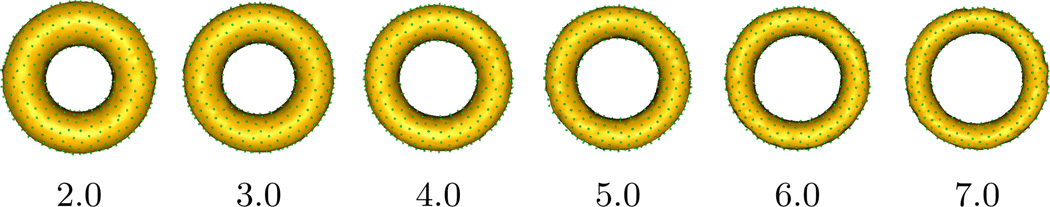
Visualizing fixed effects on the synthetic data
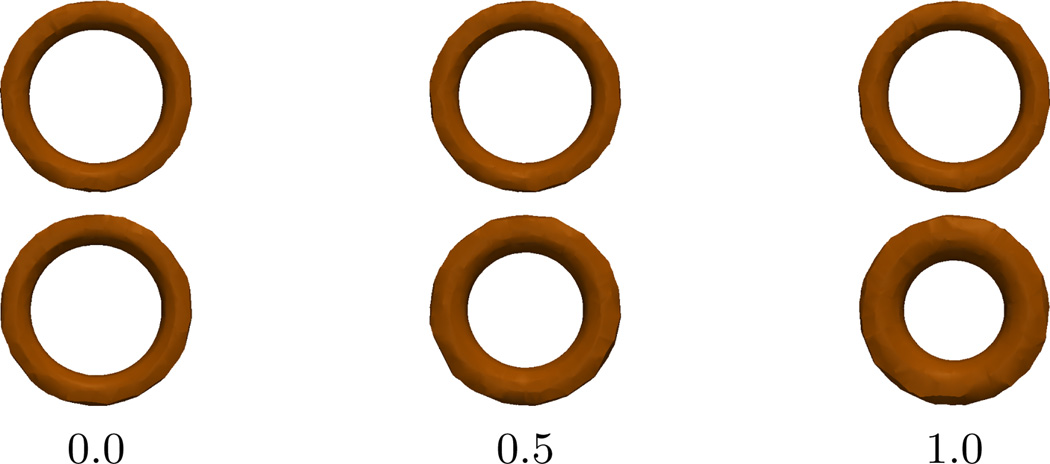
Visualizing the trends in the two groups created to test group differences: constant trend (top), trend with increasing r (bottom)
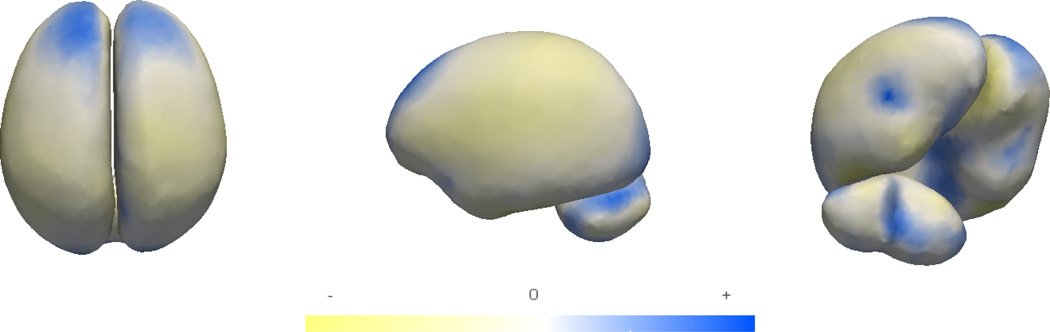
Visualizing the fixed-effects of brain structures (blue denotes expansion, and yellow denotes contraction)
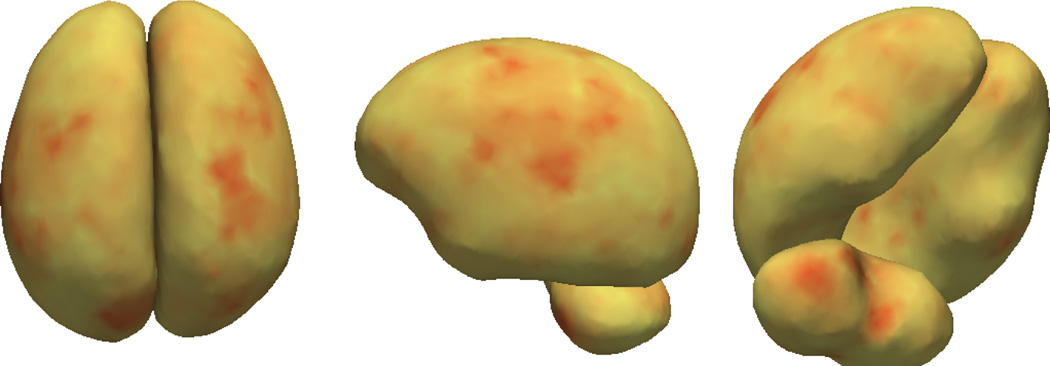
Visualizing the random-effects of brain structures (red denotes high variance regions)
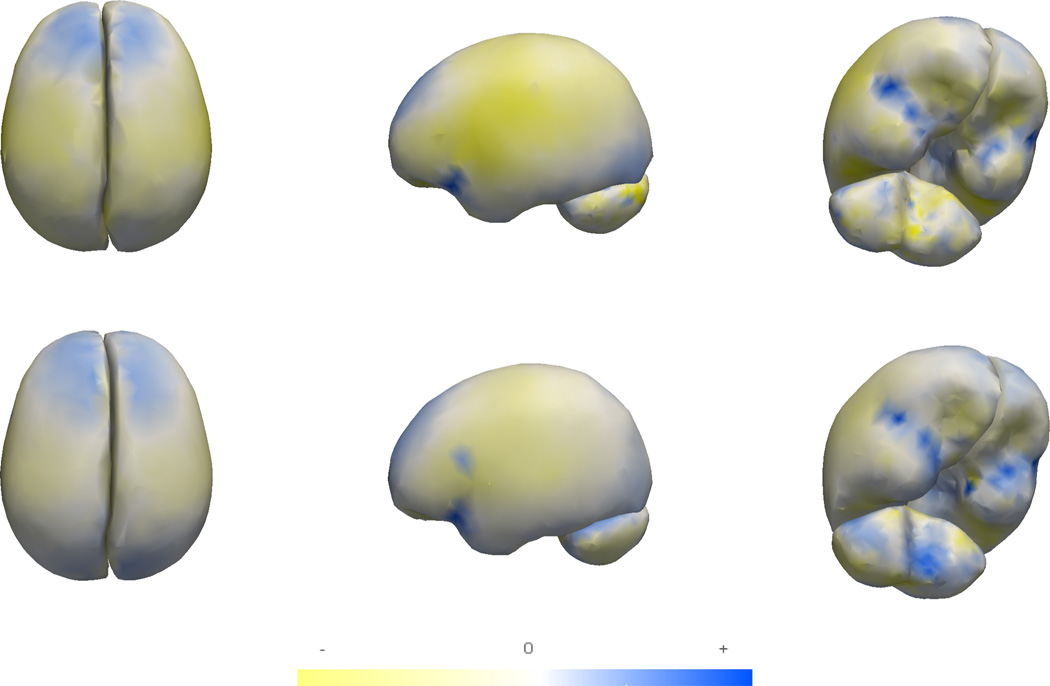
Variation in group trends for the HR+ (top) and LR− (bottom) groups (yellow denotes contraction, blue denotes expansion)
References
-
- Davis B, Fletcher P, Bullitt E, Joshi S. Population shape regression from random design data. ICCV. 2007
-
- Thompson PM, Giedd JN, Woods RP, MacDonald D, Evans AC, Toga AW. Growth patterns in the developing brain detected by using continuum mechanical tensor maps. Nature. 404:190–193. - PubMed
Grants and funding
LinkOut - more resources
Full Text Sources