. 2015 Feb:476:26-36.
doi: 10.1016/j.virol.2014.11.017. Epub 2014 Dec 12.

Mutations within A 35 amino acid region of P6 influence self-association, inclusion body formation, and Caulimovirus infectivity

Affiliations

Mutations within A 35 amino acid region of P6 influence self-association, inclusion body formation, and Caulimovirus infectivity

Lindy Lutz et al. Virology. 2015 Feb.

Abstract

Cauliflower mosaic virus gene VI product (P6) is an essential protein that forms cytoplasmic, inclusion bodies (IBs). P6 contains four regions involved in self-association, termed D1-D4. D3 binds to D1, along with D4 and contains a spacer region (termed D3b) between two RNA-binding domains. Here we show D3b binds full-length P6 along with D1 and D4. Full-length P6s harboring single amino acid substitutions within D3b showed reduced binding to both D1 and D4. Full-length P6s containing D3b mutations and fused with green fluorescent protein formed inclusion-like bodies (IL-Bs) when expressed in Nicotiana benthamiana leaves. However, mutant P6s with reduced binding to D1 and D4, showed smaller IL-Bs, than wild type. Likewise, viruses containing these mutations showed a decrease in inoculated leaf viral DNA levels and reduced efficiency of systemic infection. These data suggest that mutations influencing P6 self-association alter IB formation and reduce virus infection.

Keywords: CaMV; Gene VI product; Inclusion bodies; TAV.


Figures

Fig. 1
Fig. 1
Schematic diagram of P6 and location of mutations. The 520 amino acid P6 protein is indicated; large numbers above box indicate amino acids. Hatched areas, P6 regions involved in self-association) (Haas et al., 2005; Li and Leisner, 2002); granular region Mini-TAV region (De Tapia et al., 1993); D1 (amino acids 1-110); D2 (amino acids 156-253); shaded area, D3 (amino acids 249-379); D4 (amino acids 414-520). D3a and D3c are indicated (note both contain RNA-binding domains); black area, D3b examined in this study. Numbers in italics: number of variable amino acid positions within that portion of P6 per amino acid. The amino acid sequence of the D3b region is shown below the P6 cartoon as well as the amino acid changes for the various mutants, single letter amino acid designations are given. The D3b region is likely α-helical (black) with an intervening turn (gray) below the sequences as predicted by Garnier-Robson model in the Protean software contained within the Lasergene Software package. Helical wheels for both helices (predicted by the Protean software package) are indicated below the secondary structure prediction; black, non-polar amino acids; dark gray, uncharged polar amino acids; light gray, acidic amino acids; white, basic amino acids; amino acid numbers are given; bold italic numbers, amino acids mutated.
Fig. 2
Fig. 2
Role of the D3b region in CaMV infectivity and protein binding. A, Gel electrophoresis of PCR products from virus-infected plants. L indicates 100 bp ladder. I represents inoculated leaves; U, upper non-inoculated leaves for representative plants inoculated with either the D3b deletion mutant (Mutant; pCaMV10ΔD3b) or with wild type (Wild Type; CM1841) virus DNA. DNA indicates the PCR performed with pCaMV10 DNA (positive control); M, procedure performed on mock-inoculated plant; arrow indicates position of CaMV PCR amplification product. B, Schematic diagram of the constructs tested for leucine-independent growth and β-galactosidase activity (for C, D, and E). Black box, LexA DBD in pEG202; hatched box, B42 TAD in pJG4-5; white box, full-length or portions of CaMV P6; numbers to the left of each pair of constructions correspond to the plates in C and to the abscissa of the β-galactosidase assays shown in E. C, Growth of yeast transformants on media with (+L) and without (−L) leucine. D, key for the plates in C. E, β-galactosidase activity (units) of yeast transformants expressing constructs for three different experiments along with the standard deviation.
Fig. 3
Fig. 3
Interactions of D3b mutant P6s with P6 self-association region, D1. A, Schematic diagram of the constructs tested for leucine independent growth and β-galactosidase activity (for B, C, and D). Black box, LexA DBD in pEG202; hatched box, B42 TAD in pJG4-5; white box, full-length or portions of CaMV P6; numbers to the left of each pair of constructions correspond to abscissa of the β-galactosidase assays shown in B and the plates in C. B, β-galactosidase activity of yeast transformants expressing constructs as represented in A. C, Growth of yeast transformants on media with (+L) and without (−L) leucine. D, key for the plates in C.
Fig. 4
Fig. 4
Interactions of D3b mutant P6s with P6 self-association domain, D4. A, Schematic diagram of the constructs tested for β-galactosidase activity and leucine independent growth (for B, C, and D). Black box, LexA DBD in pEG202; hatched box, B42 TAD in pJG4-5; white box, full-length or portions of CaMV P6; numbers to the left of each pair of constructions correspond to the abscissa of the β-galactosidase assays shown in B and the plates in C. B, β-galactosidase activity (units) of yeast transformants for three different experiments along with the standard deviation. C, Growth of yeast transformants on media with (+L) and without (−L) leucine. D, key for the plates in C.
Fig. 5
Fig. 5
Fluorescent inclusion-like bodies (I-LBs) formed by constructs expressing CM1841 P6-GFP in Nicotiana benthamiana. Constructs were agroinfiltrated into N. benthamiana leaves and examined by fluorescence microscopy three days post-infiltration. Magnification bar for A and C is 10 μm. A. Distribution of green fluorescent protein (GFP) alone (top three panels); W260 P6 fused to GFP (center three panels) and CM1841 P6 fused to GFP (bottom three panels). Left panels show GFP fluorescence alone (GFP); center panels, show bright field (BF) images of the same panels; and right, bright field overlay of GFP fluorescence (MERGE). B. Average size of W260 P6-GFP and CM1841 P6-GFP I-LBs. Z-stacks obtained by fluorescence microscopy were delineated and analyzed for size differences. Error bars indicate standard error of the mean and the star indicates a statistically-significant difference (p<0.0001). C. Co-localization of P6 and eIF3g. Left panels; P6-GFP fluorescence, middle panels; eIF3g-RFP, and right panels; overlay of GFP and RFP fluorescence. Top 3 panels, with W260 P6-GFP; bottom three panels, with CM1841 P6-GFP.
Fig. 6
Fig. 6
Fluorescence microscopy of mutant P6 I-LBs. Constructs were agroinfiltrated into N. benthamiana leaves and examined by fluorescence microscopy. three days post-infiltration. Magnification bar for A and C is 10 μm. A. Distribution of fluorescence for wild type CM1841 P6 (WT) and the D3b mutants (P6-GFPs analyzed are given to left of each set of panels). Left panels, GFP fluorescence (GFP); middle panels, bright field (BF) images of the same panels; and right, bright field overlay of left and middle panels (MERGE). B. Average size of GFP-labeled I-LBs formed by P6 mutants relative to those formed by wild type is given. This was determined from the z-stacks obtained by fluorescence microscopy. Average values were normalized to the size of wild type I-LBs, that was set to 1 and standard error of the mean are given. Different letters indicate statistically significant differences (p< 0.015). C. Protein gel blot analysis of wild type and mutant P6s expressed by agroinfiltration in N. benthamiana leaves. Upper panel, blot of wild type and mutant P6-GFP fusion proteins using anti-GFP antibodies; lower panel, the neomycin phosphotransferase type II (NPTII) was detected using anti-NPTII antibodies, served as a loading control.
Fig. 7
Fig. 7
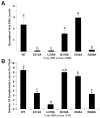
Propagation of CaMVs harboring D3b mutations in turnips. A, propagation of virus in inoculated leaves as determined by real-time PCR. Inoculated leaves were harvested at 35 days post-inoculation, DNA was isolated and real time PCR was performed, normalizing virus DNA levels against levels of 18S rDNA genes. Average values and standard error of the mean are given. Different letters indicate statistically-significant differences (p<0.001 for A). B, Average number of leaves exhibiting systemic symptoms per plant. A total of ten plants were inoculated with each virus and the average number of leaves showing systemic symptoms per plant was determined at 35 days post-inoculation. Both average and standard error of the mean are indicated; different letters indicate statistically-significant differences (p<0.03).

Similar articles

Cited by

References

    1. Acosta-Leal R, Duffy S, Xiong Z, Hammond RW, Elena SF. Advances in plant virus evolution: translating evolutionary insights into better disease management. Phytopathology. 2011;101:1136–1148. - PubMed
    1. Agama K, Beach S, Schoelz J, Leisner SM. the 5′ third of Cauliflower mosaic virus gene VI conditions resistance breakage in Arabidopsis ecotype Tsu-0. Phytopathology. 2002;92:190–196. - PubMed
    1. Anderson EJ, Trese AT, Sehgal OP, Schoelz JE. Characterization of a chimeric Cauliflower mosaic virus isolate that is more severe and accumulates to higher concentrations the either of the strains from which it was derived. Mol Plant-Microbe Interact. 1992;5:48–54.
    1. Angel CA, Lutz L, Yang X, Rodriguez A, Adair A, Zhang Y, Leisner SM, Nelson RS, Schoelz JE. The P6 protein of Cauliflower mosaic virus interacts with CHUP1, a plant protein which moves chloroplasts on actin microfilaments. Virology. 2013;443:363–374. - PubMed
    1. Armour SL, Melcher U, Pirone TP, Lyttle DJ, Essenberg RC. Helper component for aphid transmission encoded by region II of Cauliflower mosaic virus DNA. Virology. 1983;129:25–30. - PubMed

Publication types

Substances