Acoustic telemetry reveals large-scale migration patterns of walleye in Lake Huron
- PMID: 25506913
- PMCID: PMC4266611
- DOI: 10.1371/journal.pone.0114833
Acoustic telemetry reveals large-scale migration patterns of walleye in Lake Huron
Abstract
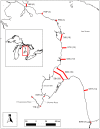
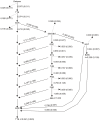
Fish migration in large freshwater lacustrine systems such as the Laurentian Great Lakes is not well understood. The walleye (Sander vitreus) is an economically and ecologically important native fish species throughout the Great Lakes. In Lake Huron walleye has recently undergone a population expansion as a result of recovery of the primary stock, stemming from changing food web dynamics. During 2011 and 2012, we used acoustic telemetry to document the timing and spatial scale of walleye migration in Lake Huron and Saginaw Bay. Spawning walleye (n = 199) collected from a tributary of Saginaw Bay were implanted with acoustic tags and their migrations were documented using acoustic receivers (n = 140) deployed throughout U.S. nearshore waters of Lake Huron. Three migration pathways were described using multistate mark-recapture models. Models were evaluated using the Akaike Information Criterion. Fish sex did not influence migratory behavior but did affect migration rate and walleye were detected on all acoustic receiver lines. Most (95%) tagged fish migrated downstream from the riverine tagging and release location to Saginaw Bay, and 37% of these fish emigrated from Saginaw Bay into Lake Huron. Remarkably, 8% of walleye that emigrated from Saginaw Bay were detected at the acoustic receiver line located farthest from the release location more than 350 km away. Most (64%) walleye returned to the Saginaw River in 2012, presumably for spawning. Our findings reveal that fish from this stock use virtually the entirety of U.S. nearshore waters of Lake Huron.
Conflict of interest statement
Figures


References
-
- Dingle H (1996) Migration: The biology of life on the move. New York: Oxford University Press. 480 p.
-
- Dingle H, Drake VA (2007) What is migration? BioScience 57:113–121.
-
- Lucas MC, Baras E (2001) Migration of freshwater fishes. Oxford: Blackwell Science.
-
- Fuller K, Shear H, Wittig J (2002) The Great Lakes: An Environmental Atlas and Resource Book. Government of Canada United States Environmental Protection Agency (US EPA/The Government of Canada), Toronto, ON p. 1–46.
Publication types
MeSH terms
LinkOut - more resources
Full Text Sources
Other Literature Sources

