. 2014 Dec 16:5:5807.
doi: 10.1038/ncomms6807.

Direct conversion of mouse and human fibroblasts to functional melanocytes by defined factors

Affiliations

Direct conversion of mouse and human fibroblasts to functional melanocytes by defined factors

Ruifeng Yang et al. Nat Commun. .

Abstract

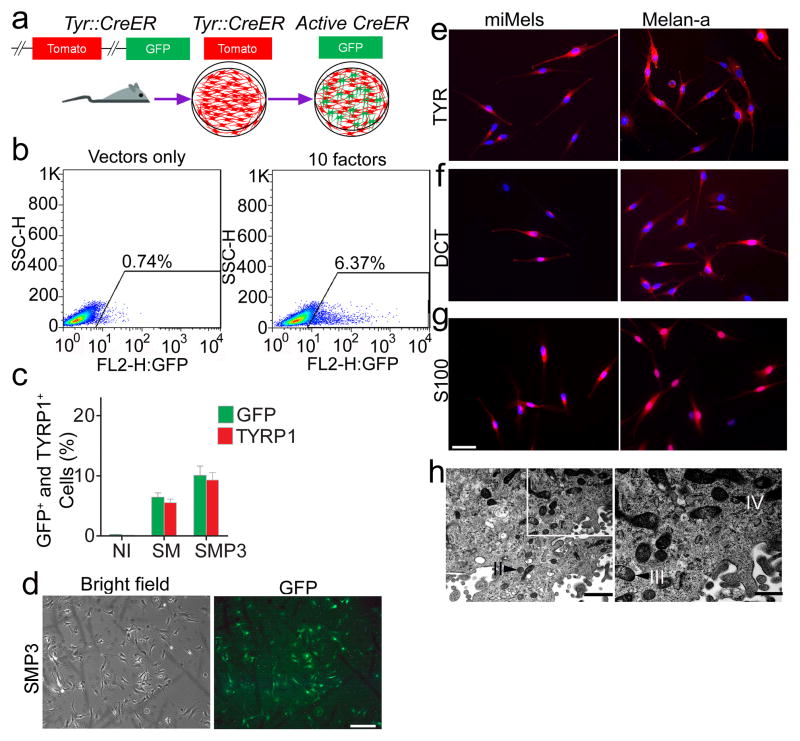
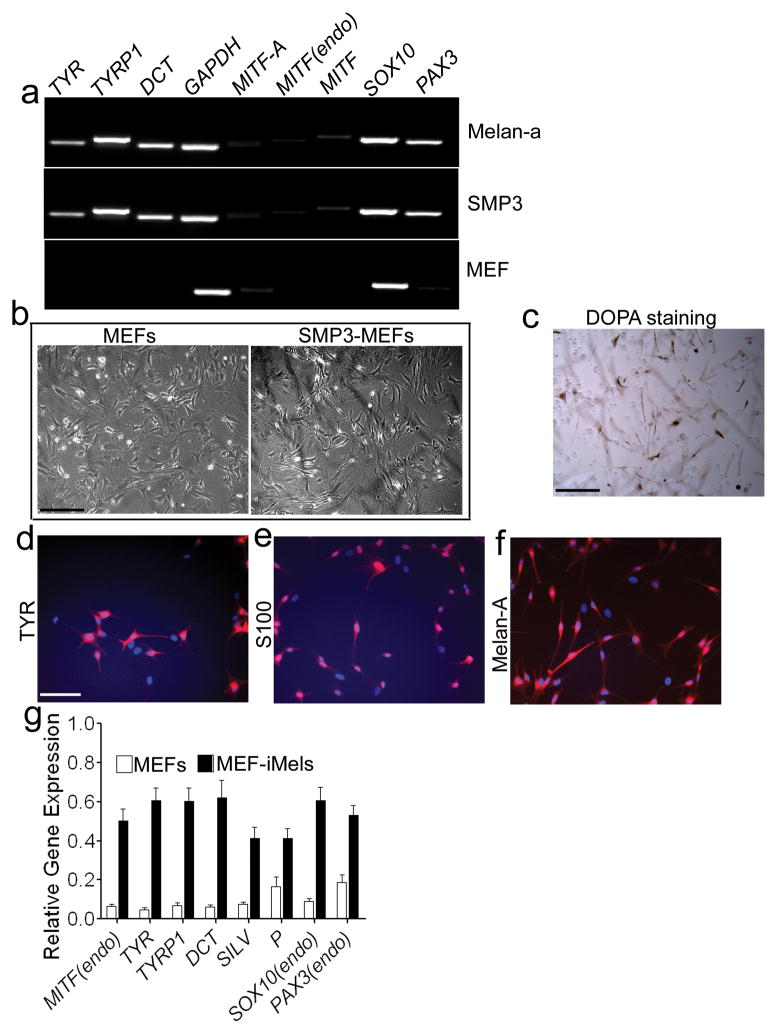
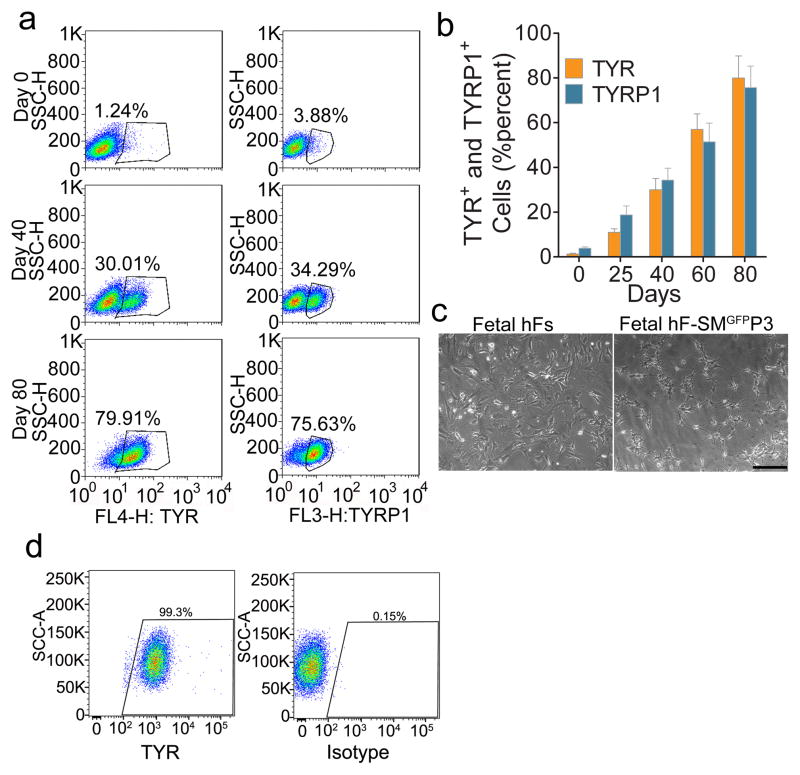
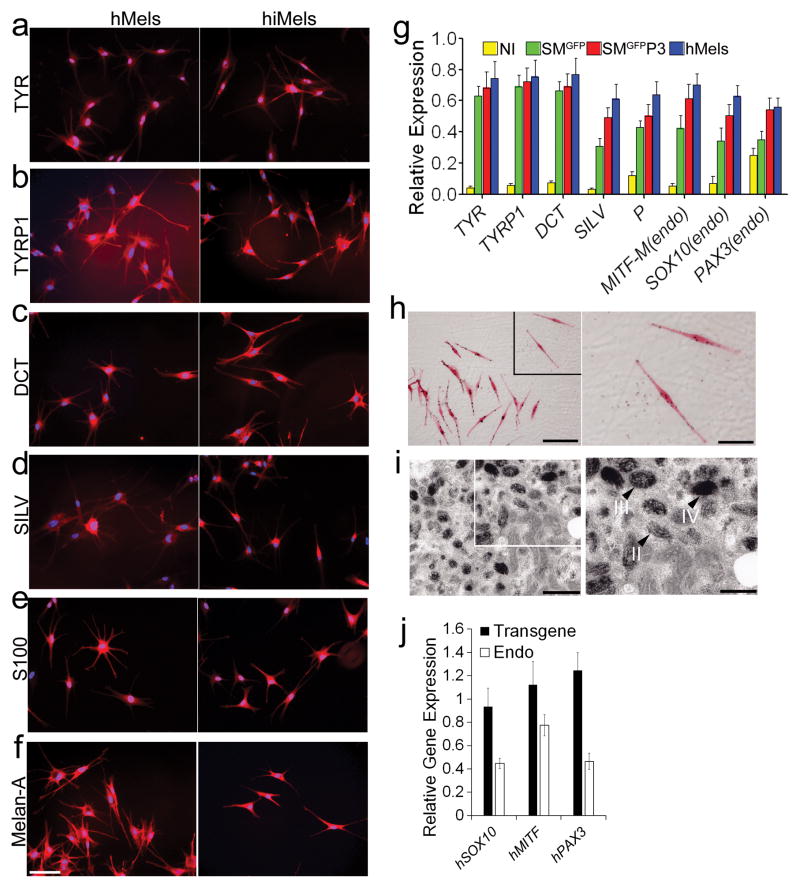
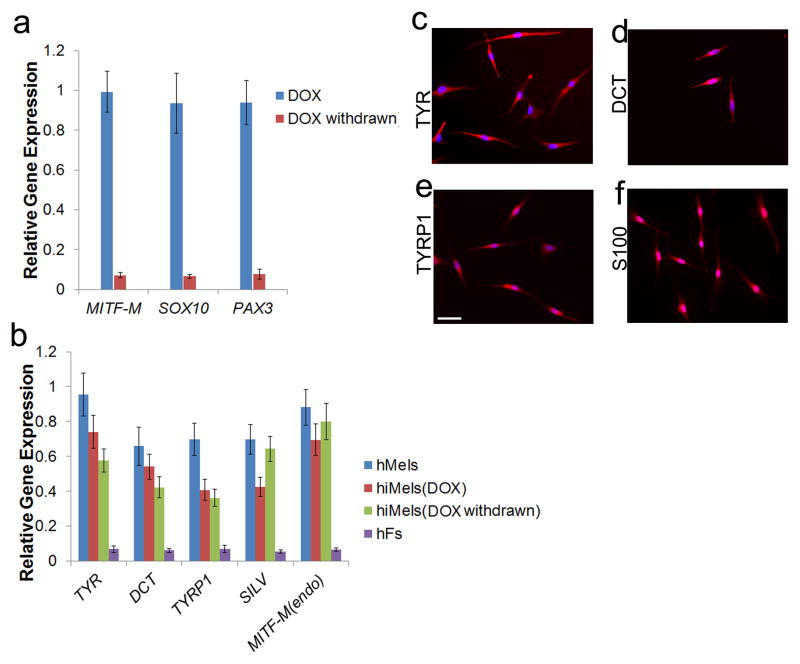
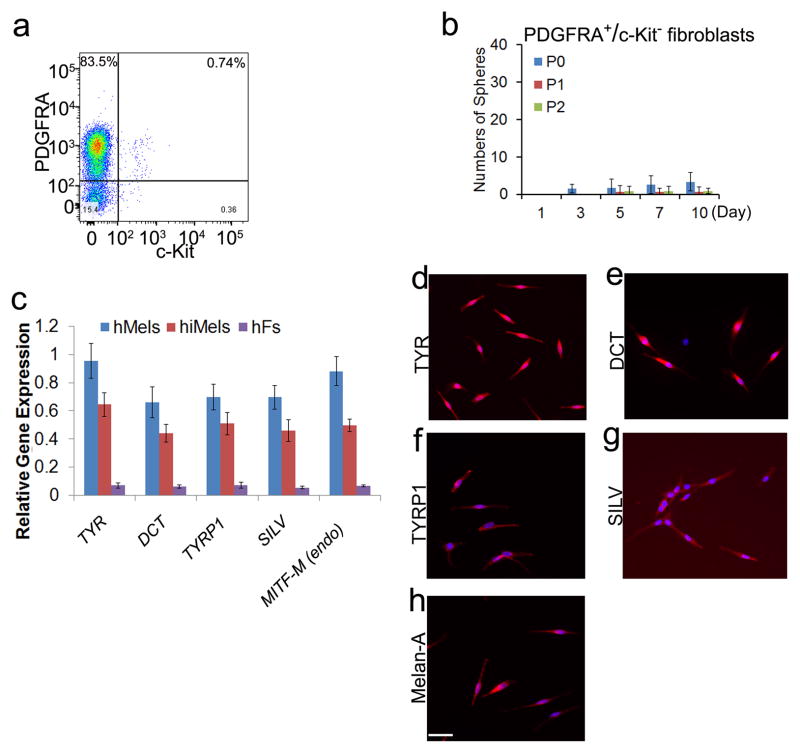
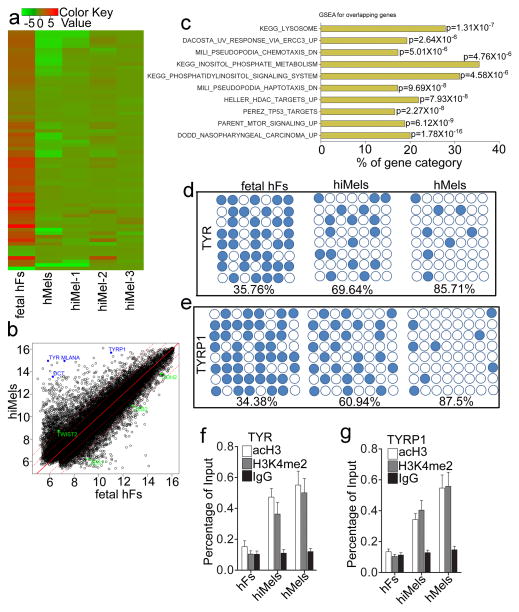
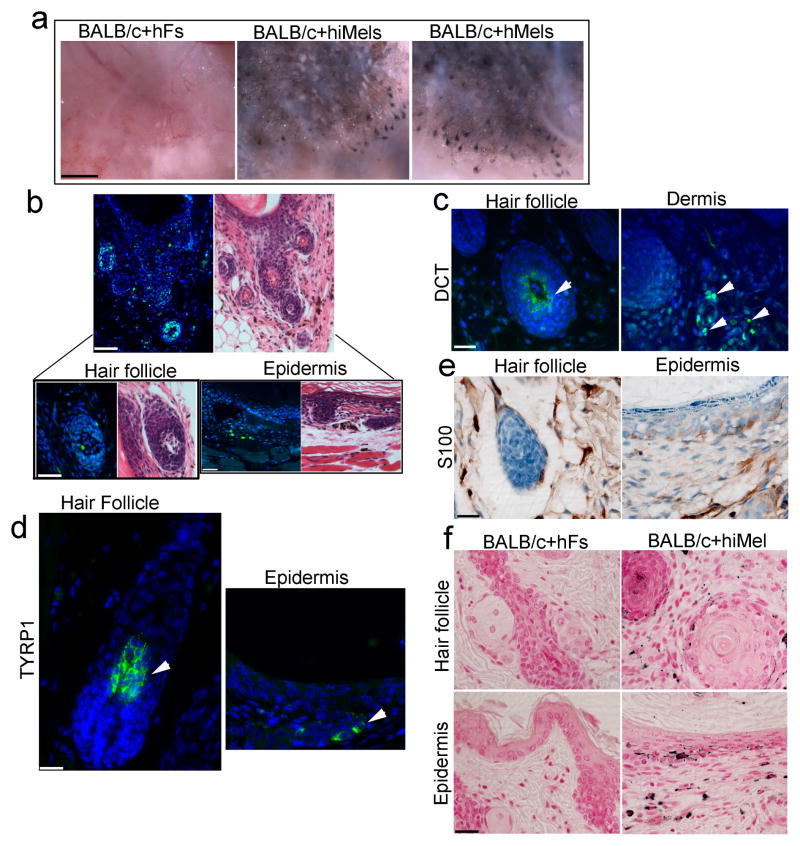
Direct reprogramming provides a fundamentally new approach for the generation of patient-specific cells. Here, by screening a pool of candidate transcription factors, we identify that a combination of the three factors, MITF, SOX10 and PAX3, directly converts mouse and human fibroblasts to functional melanocytes. Induced melanocytes (iMels) activate melanocyte-specific networks, express components of pigment production and delivery system and produce melanosomes. Human iMels properly integrate into the dermal-epidermal junction and produce and deliver melanin pigment to surrounding keratinocytes in a 3D organotypic skin reconstruct. Human iMels generate pigmented epidermis and hair follicles in skin reconstitution assays in vivo. The generation of iMels has important implications for studies of melanocyte lineage commitment, pigmentation disorders and cell replacement therapies.


Figures

Figure 1
Figure 1. Screening for melanocyte direct reprogramming factors
a. Scheme for melanocyte direct reprogramming transcription factor (TF) screening. Screening was performed using fibroblasts from the Tyrosinase-CreER/Gt(ROSA)26Sor tm4(ACTB-tdTomato,-EGFP)Luo/J mice. When tyrosinase (TYR) was activated, Cre activation resulted in excision of the tomato cassette and expression of GFP in the presence of 4-HT. b. Flow cytometric analysis of the GFP+ cells after cells were infected with viruses packaged with 10 candidate factors (right panel) or vector only (left panel). c. Flow cytometric analysis of GFP and TYRP1 expression after cells were infected with control vectors (NI), SOX10 and MITF (SM) or SOX10, MITF and PAX3 (SMP3). Representative data are from three independent experiments. d. Morphology of FACS sorted GFP+ cells. Mouse fibroblasts were infected with SMP3 and sorted based on GFP expression at Day 14. Scale bar indicates 50 μm. e–g. Immunostaining analysis of mouse induced mouse melanocytes (miMels) using antibodies specific for TYR (e), DCT (f) and S100 (g). Secondary antibody was labeled with Alexa Fluro 594. DAPI was used to stain the nuclei. Melan-a mouse melanocytes were used as a positive control. Scale bar indicates 30 μm. h. Electron microscopy analyses showed that miMels contained many mature melanosomes in the cytoplasm. Arrow heads point to the different stages of melanosomes, including stage II, III and IV. Scale bar indicates 400 nm (left panel) and 200 nm (right panel).
Figure 2
Figure 2. Direct reprogramming of MEFs to iMels
a. RT-PCR analysis of melanocytic markers in MEFs which were reprogrammed by SMP3 combination. MEFs infected with SMP3 were collected for RT-PCR analysis at Day 5 after infection. MEFs and melan-a mouse melanocytes were used as negative and positive controls, respectively. The melanocytic markers included TYR, TYRP1, DCT, MITF (endo), SOX10 and PAX3. GAPDH here was used as an internal control. b. Morphologies of parental MEFs and SMP3-induced MEFs (SMP3-MEFs). MEFs (left panel) were infected with viruses containing SMP3, cultured for 19 days and then selected under G418 and photographed (right panel). Scale bar, 50 μm. c. DOPA activity in mouse iMels. Reprogrammed cells were stained by Dopamine and showed Dopa activity. Scale bar, 50 μm. d–f. Immunocytochemical staining of iMels derived from MEFs (MEF-iMels) using antibodies specific for TYR, S100 and Melan-A. Scale bar, 25 μm. g. qRT-PCR analysis of melanocytic markers, including MITF (endo), TYR, TYRP1, DCT, P, SOX10 (endo) and PAX3 (endo) in MEF-iMels and MEFs. Data shown are mean ± SD of the expression from three independent experiments.
Figure 3
Figure 3. Direct reprogramming of human fibroblasts to iMels
a. Representative flow cytometry plots for analyses of TYR+ and TYRP1+ cells in SMGFPP3 induced cells at indicated time points. Fetal hFs were infected with SMGFPP3, sorted and selected in the medium containing G418. Cells were collected and flow cytometrically analyzed at Day 0, 40 and 80. b. Percentage of TYR+ and TYRP1+ cells in SMGFPP3 induced cells at indicated time points. Human fetal fibroblasts (fetal hFs) were infected with SMGFPP3, sorted and selected in media containing G418. Cells were analyzed by flow cytometry at Day 0, 25, 40 and 80. Representative data are from three independent experiments. c. Cell morphology of fetal hFs and iMels derived from fetal hFs. Representative images of fetal hFs and iMels derived from fetal hFs (fetal hF-SMGFPP3) were photographed at Day 40. Scale bar indicates 50 μm. d. Representative flow cytometry plots for analyses of TYR+ cells after cells were reprogramming by SMGFPP3 by Day 100.
Figure 4
Figure 4. Characterization of directly reprogrammed human iMels from fetal dermal fibroblasts
a–f. Immunostaining analysis of human iMels (hiMels) derived from fetal hFs and normal human skin melanocytes (hMels) using antibodies specific for TYR(a), TYRP1 (b), DCT (c), SILV (d), S100 (e) and Melan-A (f). The secondary antibody was labeled with Alexa Fluro 594. DAPI was used to stain the nuclear DNA. Scale bar indicates 20 μm. g. qRT-PCR analysis of melanocytic specific markers in fetal hFs infected with vector virus only (NI), SMGFP and SMGFPP3 and hMels. Melanocytic markers included TYR, TYRP1, DCT and SILV, and endogenous SOX10, MITF and PAX3. Data shown here are mean ± SD of the expression from three independent experiments. h. Fontana-Masson staining showed melanin pigments in hiMels. Scale bars indicate 25 μm in left panel and 10 μm in right panel. Arrow heads point to the melanin pigment. i. Electron microscopy images of hiMels with many mature melanosomes in the cytoplasm. II: stage II melanosome; III: stage III melanosome; IV: stage IV melanosome. Scale bars indicate 800 nm in left panel and 400 nm in right panel. Arrow heads point to melanosomes. j. qRT-PCR analysis of transgenic and endogenous (Endo) expression of human PAX3 (hPAX3), human SOX10 (hSXO10) and human MITF (hMITF) in hiMels. Data shown are mean ± SD of the expression from three independent experiments.
Figure 5
Figure 5. Generation of hiMels using inducible system
Human MITF-M, SOX10 and PAX3 were subcloned into Doxycycline inducible viral vectors. Fetal hFs were infected with viruses carrying these three transgenes. a. qRT-PCR analysis of the transgenic expression of SOX10, MITF and PAX3 in the presence or absence of DOX. b. qRT-PCR analysis of melanocytic markers in hiMels which were stopped treating by DOX (DOX withdrawn), hiMels with DOX persistent induction (DOX), hMels and fetal hFs. hMels and fetal hFs here were used as positive and negative controls, respectively. Data shown are mean ± SD of the expression from three independent experiments. c–f. Immunostaining analysis of melanocytic markers including TYR (c), DCT (d), TYRP1 (e) and S100 (f) in hiMels which showed no transgenic SOX10, MITF and PAX3 expression without treating by DOX. Scale bar, 30 μm.
Figure 6
Figure 6. Characterization of hiMels induced from purified human fetal fibroblasts
Human fetal PDGFRA+/c-Kit fibroblasts were reprogrammed using SMGFPP3. a. Flow cytometric analysis of the percentage of PDGFRA+ and c-Kit+ cells in primary human fetal fibroblasts. Representative data are from three independent experiments. b. Sphere formation capacity of PDGFRA+/c-Kit fibroblasts from primary fetal fibroblasts. P0 fibroblasts were MACS microbeads purified using an antibody against PDGFRA (positive selection) and c-Kit (negative selection). PDGFRA+/c-Kit fibroblasts were experimented in the sphere formation assays. P0 indicates Passage 0, P1 indicates Passage 1 and P2 indicates Passage 2. Representative data are from three independent experiments. c. qRT-PCR analysis of melanocytic markers in hMels, hiMels derived from human fetal PDGFRA+/c-Kit fibroblasts (hiMels) and human fetal PDGFRA+/c-Kit fibroblasts (hFs). Data shown here are mean ± SD of gene expression from three independent experiments. d-h. Immunostaining analysis of melanocytic markers in hiMels including TYR (d), DCT (e), TYRP1 (f), SILV (g) and Melan-A (h). Scale bar, 30 μm.
Figure 7
Figure 7. Molecular characterization of induced human melanocytes
a. Heat-map of genes differentially expressed in RNA-microarray analysis performed on human fetal fibroblasts (fetal hFs), induced melanocytes derived from human fetal fibroblast (hiMels) and normal skin melanocytea (hMels). b. Scatter plots show that melanocytic markers are expressed in hiMels, but not in fetal hFs. c. Gene Set Enrichment Analysis (GSEA) for the overlapping genes between hMels and hiMels. Many gene sets including KEGG_LYSOSOME, DACOSTA_UV_RESPONSE_VIA_ERCC3, PARENT_MTOR_SIGNALING_UP, MILI_PSEUDOPODIA_HAPTOTAXIS_DN and MILI_PSEUDOPODIA_CHEMOTAXIS_DN were enriched in hiMels and hMels. d and e. DNA methylation analysis of the promoters of TYR (d) and TYRP1 (e) in fetal hFs, hiMels and hMels. Open circles indicate unmethylated CpG dinucleotides, while closed circles indicate methylated CpGs. f and g. Histone modification analysis of promoters of TYR and TYRP1 in fetal hFs, hiMels and hMels. Chromatin immunoprecipitation was performed using antibodies against dimethylated histone H3K4 (H3K4me2) and H3 acetylation (acH3). TYR and TYRP1 promoters showed enrichment for the active states (H3K4 me2 and acH3) in hiMels and hMels. In fetal hFs, TYR and TYRP1 promoters appeared in the inactive state. Representative data are from three independent experiments.
Figure 8
Figure 8. Functional analysis of induced human melanocytes in vivo
a. Skin reconstitution assays showed pigmented hair follicles using hiMels. hiMels, hMels or fetal hFs combined with neonatal mouse dermal fibroblasts and epithelial cells derived from BALB/c (albino) mouse skin. Cells were injected into the back skin of an immunodeficient mouse. After 3 weeks, grafts were photographed from the underside of the skin. Pigmented hair follicles were observed in hiMels or hMels groups in the skin reconstitution assays, whereas pigmented hair follicles were not observed in the group containing fetal hFs. Scale bar, 5 mm. n=5. b. Human specific Alu staining (green nuclei) confirmed human origin of iMels (left, upper panel) and H&E staining of consecutive section showed a cyst with hair follicle formation (right, upper panel); Scale bar, 200 μm. Human cells located in the bulb region of a hair follicle (left, lower panel) and basal layer of epidermis (right, lower panel); Scale bar, 50 μm. c and d. Immunostaining of the xenografts from the patch assays using antibodies against human DCT (c) and TYRP1 (d). DCT+ cells were present in the interfollicular dermis and bulb region of hair follicles. TYRP1+ cells were observed in both hair follicles and the epidermis. Scale bar, 20 μm. e. Immunohistochemical staining of the xenografts using the antibody against human S100. S100+ positive cells were located in epidermis, hair follicle and the dermis. Scale bar, 20 μm. f. Fontana-Masson staining of the xenografts showed no pigment in xenografts formed by fetal hFs and mouse cells (left); whereas abundant melanin pigment was evident in the epidermis and follicular epithelium when hiMels were included in the assays (right). Scale bar, 20 μm.

References

    1. Slominski A, Tobin DJ, Shibahara S, Wortsman J. Melanin pigmentation in mammalian skin and its hormonal regulation. Physiol Rev. 2004;84:1155–1228. - PubMed
    1. Alikhan A, Felsten LM, Daly M, Petronic-Rosic V. Vitiligo: a comprehensive overview Part I. Introduction, epidemiology, quality of life, diagnosis, differential diagnosis, associations, histopathology, etiology, and work-up. J Am Acad Dermatol. 2011;65:473–491. - PubMed
    1. Hann SK, Im S, Bong HW, Park YK. Treatment of stable vitiligo with autologous epidermal grafting and PUVA. J Am Acad Dermatol. 1995;32:943–948. - PubMed
    1. Caiazzo M, et al. Direct generation of functional dopaminergic neurons from mouse and human fibroblasts. Nature. 2011;476:224–227. - PubMed
    1. Huang P, et al. Induction of functional hepatocyte-like cells from mouse fibroblasts by defined factors. Nature. 2011;475:386–389. - PubMed

Publication types

MeSH terms

Associated data