. 2014 Dec 15:14:958.
doi: 10.1186/1471-2407-14-958.

L1CAM is expressed in triple-negative breast cancers and is inversely correlated with androgen receptor

Affiliations

L1CAM is expressed in triple-negative breast cancers and is inversely correlated with androgen receptor

Kai Doberstein et al. BMC Cancer. .

Abstract

Background: Breast cancer is a heterogeneous disease displaying distinct molecular features and clinical outcome. The molecular profile of triple-negative breast cancers (TNBCs) overlaps with that of basal-like breast cancers that in turn show similarities with high-grade serous ovarian and endometrial carcinoma. L1CAM is an established biomarker for the latter cancers and we showed before that approximately 18% of primary breast cancers are positive for L1CAM and have a bad prognosis. Here we analysed the expression of L1CAM breast cancer subtypes.

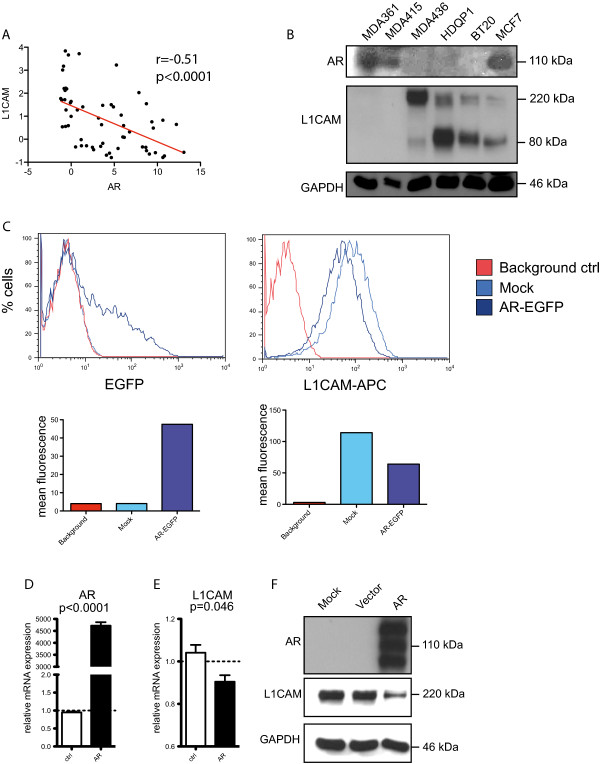
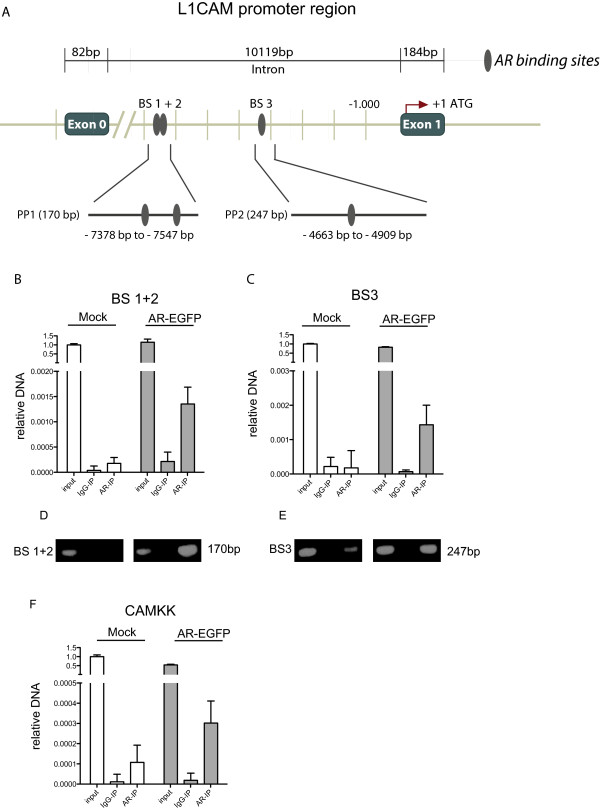
Methods: We analyzed mRNA and protein expression data from different breast cancer cohorts for L1CAM, estrogen receptor, progesterone receptor, Her-2 and Androgen receptor (AR) and correlated the data. We performed Western blot analysis on tumor cell lysates and carried out chromatin-immuno-precipitation (CHIP) after AR overexpression.

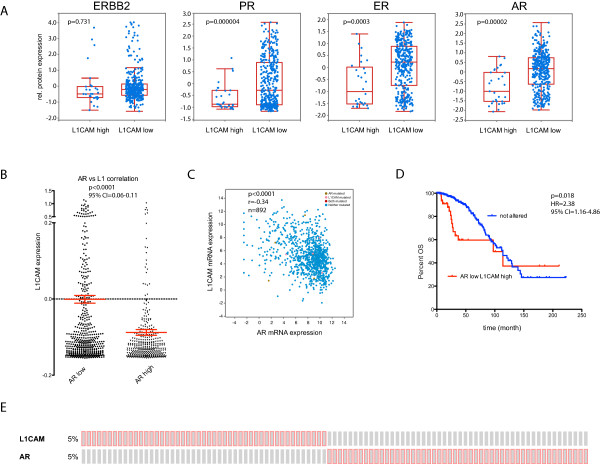
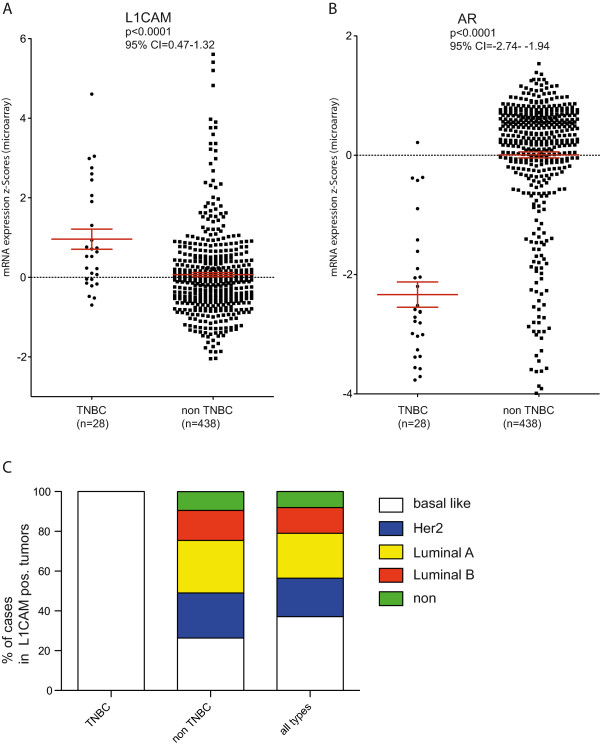
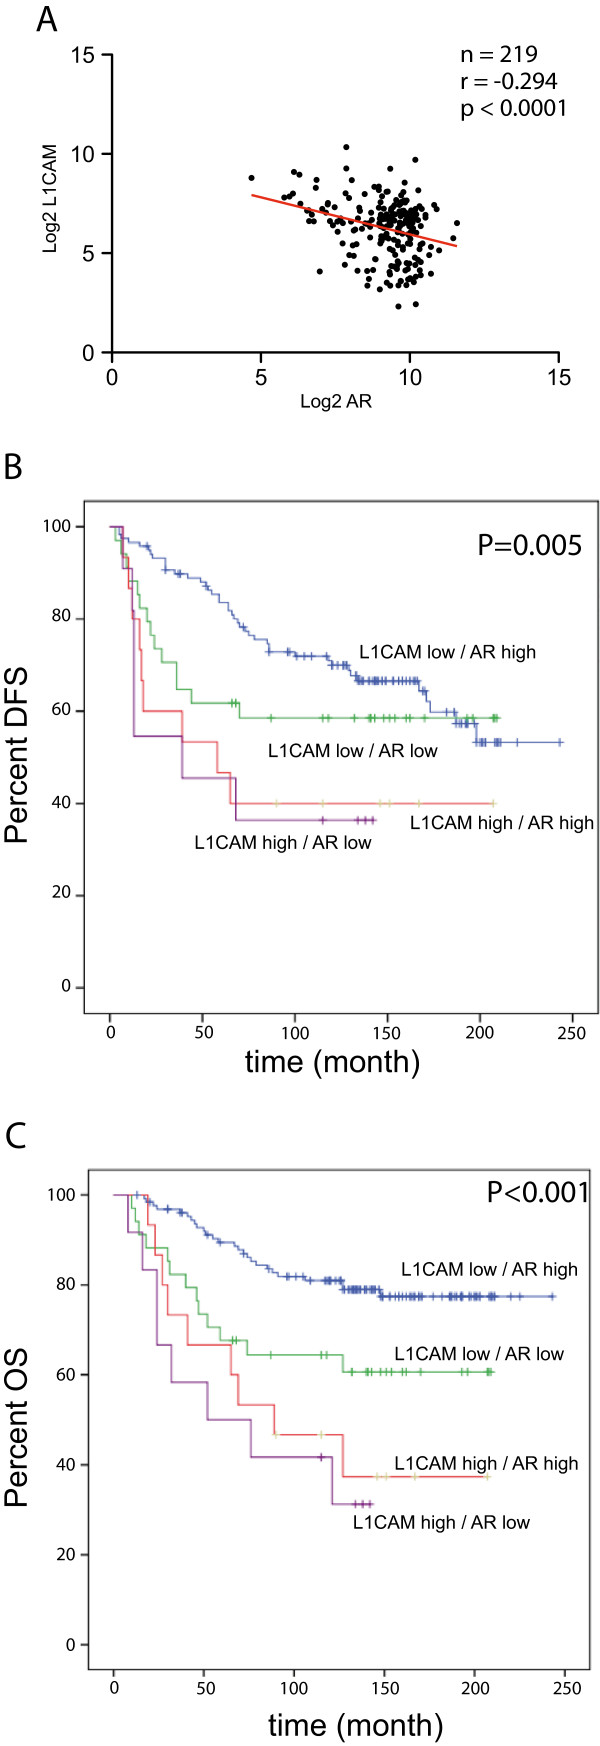
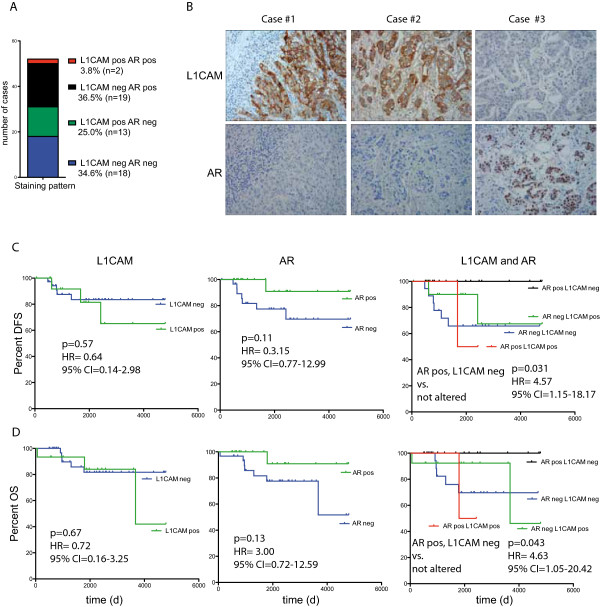
Results: We find that L1CAM is expressed preferentially though not exclusively in TNBCs. Using the human cancer genome atlas database and two independent breast cancer cohorts we find that L1CAM is inversely correlated with androgen receptor (AR) expression. We found that L1CAM(high)AR(low) primary breast tumors have the worst clinical outcome. Overexpression of AR in MDA-MB436 breast cancer cells decreased L1CAM expression at the protein and mRNA level and CHIP-analysis revealed binding of AR to the L1CAM promoter region.

Conclusions: These results suggest that L1CAM in breast cancer is under AR control. The data also strongly advocate the use of L1CAM assessment in breast cancer diagnosis. We suggest that L1CAM expression could be causally related to the bad prognosis of TNBCs.


Figures

Figure 1
Figure 1
L1CAM mRNA expression in the TCGA breast cancer collective negatively correlates to AR protein and mRNA expression. Analysis of data from the Breast Invasive Carcinoma (TCGA, Provisional) study using cBioportal. The dataset includes 1002 cases of breast cancer patients. All correlation values were calculated by spearman. (A) Differences in ERBB2, PGR, AR and PGR protein expression of samples that express high amounts of L1CAM mRNA (L1CAM high: Expression > 1.3) to unaltered samples (L1CAM low: Expression < 1.3). (B) L1CAM mRNA expression of specimens that express low (AR low, n = 536) or high (AR high, n = 356) amounts of AR mRNA. P < 0.0001, 95% CI = 0.06-0.11. (C) Scatter plot of L1CAM mRNA expression to AR mRNA expression. Values are given in (RNA Seq V2 RSEM) in log2. n = 892, r = -0.34, P < 0.0001. (D) Kaplan Meier analysis of month survival of cases that express high amounts of L1CAM (Expression > 1.3) together with low amounts of AR (Expression < 1.3) (red line) compared to not altered patients (blue line). P = 0.018, HR = 2.38, 95% CI = 1.16-4.86. (E) Cases set showing overexpression of L1CAM (5%, Expression > 1.3) or AR (5%, Expression > 1.3). Red boxes represent cases with expression > 1.3; gray boxes: unaltered or < 1.3.
Figure 2
Figure 2
L1CAM expression is preferentially observed in TNBCs. (A) TNBCs (n = 28) and non-TNBCs (n = 438) from the TCGA breast cancer cohort were analyzed for the expression of L1CAM. P < 0.0001, 95% CI = 0.47-1.32 (B) TNBCs (n = 28) and non-TNBCs (n = 438) from the TCGA breast cancer cohort were analyzed for the expression of AR. P < 0.0001, 95% CI = -2.74- -1.94 (C) Distribution of histological subtypes in TNBC and non-TNBC tumors that express L1CAM.
Figure 3
Figure 3
L1CAM mRNA expression correlates negatively to AR expression in the Hamburg cohort. (A) Scatter plot of L1CAM mRNA expression to AR mRNA expression. Values are given in (RNA Seq V2 RSEM) in log2. n = 219, r = -0.294, P < 0.0001. Kaplan Meier analysis of disease free survival (B) (AR pos, L1CAM neg vs. AR neg L1CAM pos: P = 0.005) and overall survival (C) (AR pos, L1CAM neg vs. AR neg L1CAM pos: P < 0.001) of cases that express different combination of L1CAM and AR. L1CAMlow/ARhigh (blue line), L1CAMlow/ARlow (green line), L1CAMhigh/ARhigh (red line), L1CAMhigh/AR low (violet line).
Figure 4
Figure 4
Staining examples for L1CAM and AR breast cancer tissue sections. (A) Staining pattern, showing the number of cases of the TNBC Innsbruck cohort that were stained by IHC for L1CAM and AR. Details are summarized in Table 1 (n = 52). (B) IHC staining for L1CAM and AR on representative sections from the Innsbruck cohort. Kaplan Meier analysis of disease free survival (DFS) (C) and overall survival (OS) (D) of the Innsbruck cohort that were stained by IHC for L1CAM and AR.
Figure 5
Figure 5
Analysis of breast cancer cell lines for L1CAM and AR expression. (A) The TCGA Cancer Cell Line Encyclopedia (Novartis/Broad, Nature 2012) of breast cancer cell lines was analyzed with the cBio data portal. The dataset includes 59 different breast cancer cell lines. Scatter plot showing L1CAM mRNA expression to AR mRNA expression. Values are given in mRNA Expression z-Scores. r = -0.51, P < 0.0001. (B) Western blot analysis of breast cancer cell lines: MDA361, MDA415, MDA436, HDQP1, BT20 and MCF7. Blot was analyzed with specific antibodies against AR, L1CAM and GAPDH as a loading control. (C) Representative FACS analysis of MDA436 cells that were transfected with an AR-EGFP vector or Mock. Upper row: FACS curves (% cells against log2 intensity) of EGFP and L1CAM (L1CAM-APC) stained with APC. Lower row: calculated mean fluorescence of each curve (n = 4). Transfected cells of (C) were analyzed by qPCR for AR (D) and L1CAM (E) expression. (F) Western blot analysis of MDA436 cells that were transfected with AR-EGFP, an empty vector or mock. Blots were analyzed with specific antibodies against AR, L1CAM and GAPDH as loading control (n = 3).
Figure 6
Figure 6
AR binds to sites located between Exon 0 and Exon 1 of the L1CAM gene. (A), Schematic representation of the localization of the AR binding sites in the L1CAM gene. Upper row: Distal localization of the AR binding sites in relation to the L1CAM promoter region. Middle row: localization of binding sites 1 and 2 (BS 1+2) and binding site 3 (BS 3) between Exon 0 and Exon 1. Lower row: The localizations of primer products PP1 and PP2 are shown. An immune-precipitation (IP) of MDA436 cells transfected with AR-EGFP or mock was performed with an AR (AR-IP) antibody or a IgG (IgG-IP) control antibody. Precipitated DNA was analyzed by qPCR amplification for BS 1+2 (B) and BS 3 (C) (n = 3). The input was used as a positive control. Agarose gel electrophoresis of the BS 1+2 (D) and BS 3 (E) amplification products. (F) Precipitated DNA was analyzed by qPCR amplification for the AR binding site in the CAMKK gene. Note that the same AR-IP material was used but CAMKK specific primers (n = 3).

References

    1. Dent R, Trudeau M, Pritchard KI, Hanna WM, Kahn HK, Sawka CA, Lickley LA, Rawlinson E, Sun P, Narod SA. Triple-negative breast cancer: clinical features and patterns of recurrence. Clin Cancer Res. 2007;13(15 Pt 1):4429–4434. doi: 10.1158/1078-0432.CCR-06-3045. - DOI - PubMed
    1. Oakman C, Viale G, Di Leo A. Management of triple negative breast cancer. Breast. 2010;19(5):312–321. doi: 10.1016/j.breast.2010.03.026. - DOI - PubMed
    1. Perou CM, Sorlie T, Eisen MB, van de Rijn M, Jeffrey SS, Rees CA, Pollack JR, Ross DT, Johnsen H, Akslen LA, Fluge O, Pergamenschikov A, Williams C, Zhu SX, Lonning PE, Borresen-Dale AL, Brown PO, Botstein D. Molecular portraits of human breast tumours. Nature. 2000;406(6797):747–752. doi: 10.1038/35021093. - DOI - PubMed
    1. Sorlie T, Perou CM, Tibshirani R, Aas T, Geisler S, Johnsen H, Hastie T, Eisen MB, van de Rijn M, Jeffrey SS, Thorsen T, Quist H, Matese JC, Brown PO, Botstein D, Lonning PE, Borresen-Dale AL. Gene expression patterns of breast carcinomas distinguish tumor subclasses with clinical implications. Proc Natl Acad Sci U S A. 2001;98(19):10869–10874. doi: 10.1073/pnas.191367098. - DOI - PMC - PubMed
    1. Cancer Genome Atlas N Comprehensive molecular portraits of human breast tumours. Nature. 2012;490(7418):61–70. doi: 10.1038/nature11412. - DOI - PMC - PubMed
Pre-publication history
    1. The pre-publication history for this paper can be accessed here: http://www.biomedcentral.com/1471-2407/14/958/prepub

Publication types

MeSH terms