. 2015 Apr;18(2):175-89.
doi: 10.1007/s10456-014-9455-0. Epub 2014 Dec 16.

Tipping off endothelial tubes: nitric oxide drives tip cells

Affiliations

Tipping off endothelial tubes: nitric oxide drives tip cells

Mani Krishna Priya et al. Angiogenesis. 2015 Apr.

Abstract

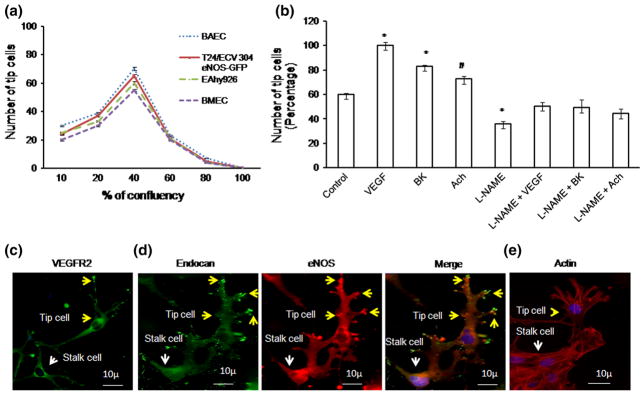
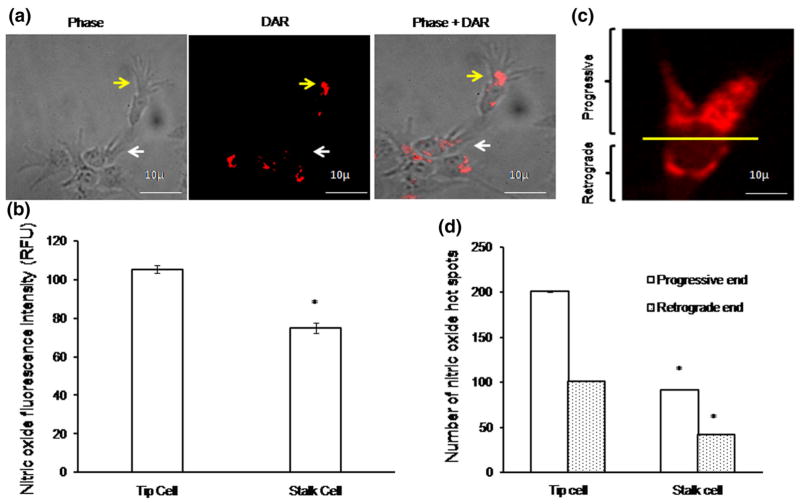
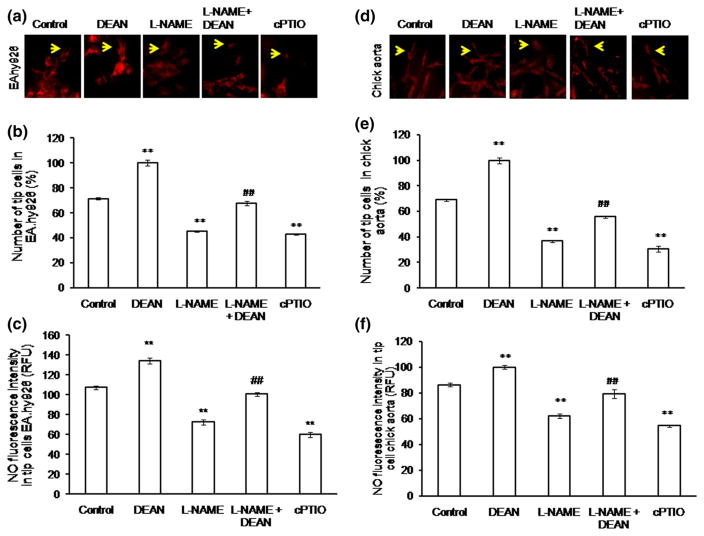
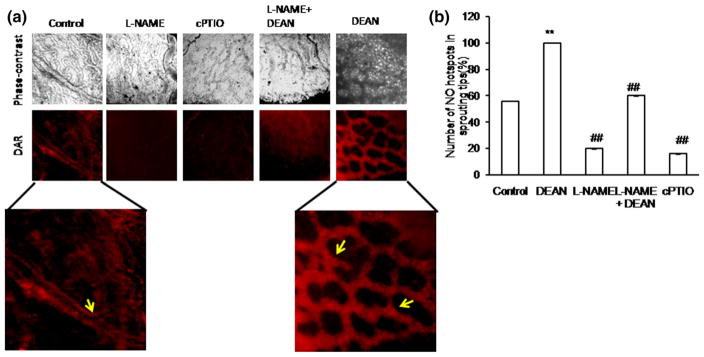
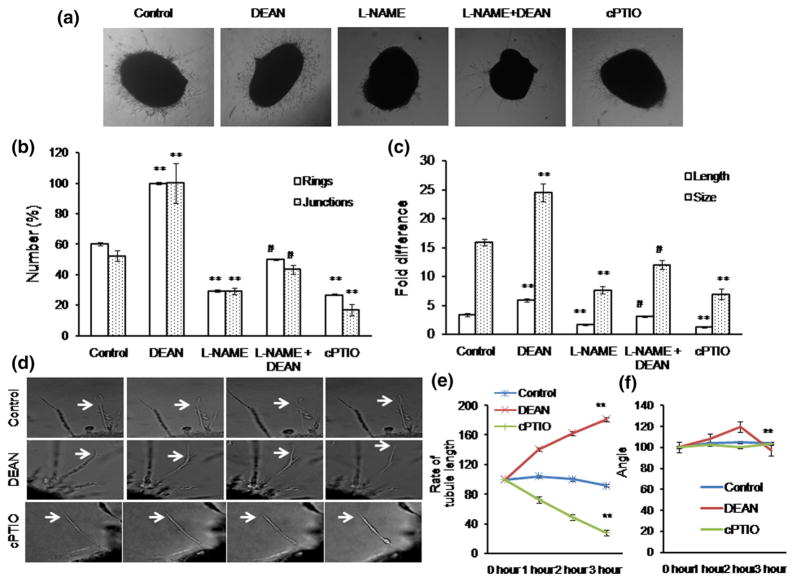
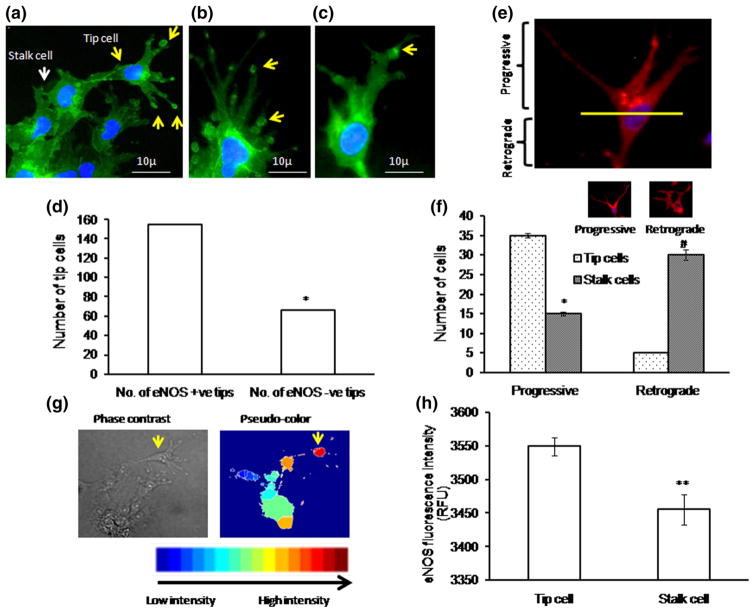
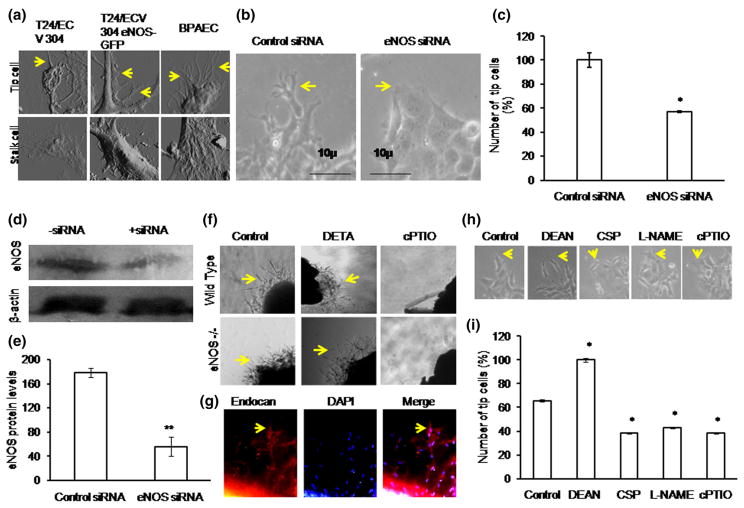
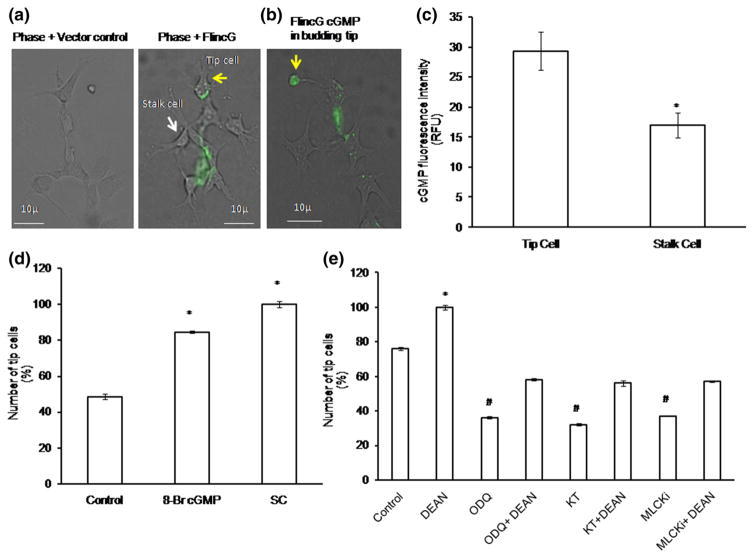
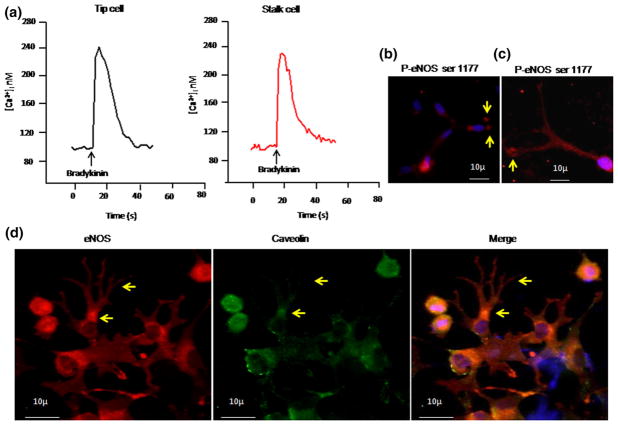
Angiogenesis, the formation of new blood vessels from pre-existing vessels, is a complex process that warrants cell migration, proliferation, tip cell formation, ring formation, and finally tube formation. Angiogenesis is initiated by a single leader endothelial cell called "tip cell," followed by vessel elongation by "stalk cells." Tip cells are characterized by their long filopodial extensions and expression of vascular endothelial growth factor receptor-2 and endocan. Although nitric oxide (NO) is an important modulator of angiogenesis, its role in angiogenic sprouting and specifically in tip cell formation is poorly understood. The present study tested the role of endothelial nitric oxide synthase (eNOS)/NO/cyclic GMP (cGMP) signaling in tip cell formation. In primary endothelial cell culture, about 40% of the tip cells showed characteristic sub-cellular localization of eNOS toward the anterior progressive end of the tip cells, and eNOS became phosphorylated at serine 1177. Loss of eNOS suppressed tip cell formation. Live cell NO imaging demonstrated approximately 35% more NO in tip cells compared with stalk cells. Tip cells showed increased level of cGMP relative to stalk cells. Further, the dissection of NO downstream signaling using pharmacological inhibitors and inducers indicates that NO uses the sGC/cGMP pathway in tip cells to lead angiogenesis. Taken together, the present study confirms that eNOS/NO/cGMP signaling defines the direction of tip cell migration and thereby initiates new blood vessel formation.


Figures

Fig. 1
Fig. 1
Tip cell characterization: a Endothelial cells (BAEC, BMEC, EA.hy926, and T24/ECV 304 eNOS-GFP) were seeded on the Matrigel-coated coverslips. Among various cell confluences, 40 % confluence allows effective tip cell sprouting (n = 3). Almost, BAEC, EA.hy926, and T24/ECV 304 eNOS-GFP showed similar number of tip cells. b Tip cell number was counted under various pro-angiogenic factors; VEGF, BK, and Ach above control and the combination of L-NAME + VEGF, L-NAME + BK, L-NAME + Ach. Significant increase in tip cell number was observed (n = 3; *p<0.001 vs control, #p = 0.027 vs control). c, d Fluorescence imaging of tip cells in BAECs. Tip cells were characterized using known tip cell marker VEGFR2 and endocan. Immunofluorescence was carried out in BAEC. VEGFR2 was found to be high in tip cells than stalk cells. Endocan was tagged with FITC, and eNOS was tagged with TRITC. Endocan hot spots, which match with eNOS hot spots, were found to be more in tip cells (yellow arrow mark) than stalk cells (white arrow mark). e Representative actin rich filopodia in tip cells (yellow arrow mark) and stalk cells (white arrow mark); actin staining is shown in red, and DAPI staining is shown in blue. (Color figure online)
Fig. 2
Fig. 2
NO imaging using DAR: a EA.hy926 cells were incubated with NO-specific fluorescence probe DAR for 10 min, ×1 PBS wash was provided, and the images were captured using fluorescence microscope. Phase, DAR, and phase + DAR probed images of tip cell (yellow arrow mark) and stalk cell (white arrow mark). b Fluorescence intensity measurement, against NO, in tip cell and stalk cell was calculated using Adobe Photoshop version 7.0. Significant increase in NO fluorescence intensity was observed in tip cells than stalk cells (n ≥ 3, *p<0.001 vs tip cell). c Representative image shows the progressive (upper part) and retrograde end (lower part) within the tip cell. d Numbers of nitric oxide hot spots were counted in both tip cell and stalk cell progressive and retrograde ends, and the graph was plotted (n>3, *p = 0.001). (Color figure online)
Fig. 3
Fig. 3
NO promotes tip cell formation in EA.hy926 and in chick aorta: a representative images of control, DEAN, L-NAME, L-NAME + DEAN, and cPTIO treatment in EA.hy926. After treatment, EA.hy926 cells were incubated with DAR, and the images were captured using fluorescence microscope. b EA.hy926 cells were subjected to form tip cells, and the number of tip cells was counted under DEAN (NO donor), NO scavenger and inhibitor (cPTIO and L-NAME) and the combination treatment of L-NAME + DEAN. A significant increase in tip cell number was observed under DEAN treatment, whereas L-NAME and cPTIO reduced the tip cell number (n ≥ 3, **p<0.001 vs control, ##p<0.05 vs L-NAME). c NO in endothelial tip cells. EA.hy926 cells were treated with NO fluorescence probe DAR for 10 min, and the fluorescence images were taken. Fluorescence intensity was calculated using Adobe Photoshop version 7.0, and the graph was plotted (n ≥ 3, **p<0.001 vs control, ##p<0.05 vs L-NAME). d Representative images of control, DEAN, L-NAME, L-NAME + DEAN, and cPTIO treatment in chick aorta. e DEAN treatment increased the tip cell sprouting in chick aortic rings. The tip cell number was significantly decreased in the presence of L-NAME and cPTIO (n ≥ 3, **p<0.001 vs control, ##p<0.05 vs L-NAME). f Chick aortic rings were treated with DAR and incubated for 20 min, and the fluorescence intensity measurement was calculated using Adobe Photoshop 7.0. (n ≥ 3, **p<0.001 vs control, ##p<0.05 vs L-NAME). (Color figure online)
Fig. 4
Fig. 4
Ex vivo imaging of NO in chick vascular bed: a Fourth day eggs were broke open in a petri dish. The vascular beds were incised out using a sterile scissor, and ×1 PBS wash was provided. Treatments, which include control, DEAN, L-NAME, L-NAME + DEAN, and cPTIO, were provided in the media and incubated for 30 min. After 30 min of treatment, the vascular bed was then incubated with NO-specific fluorescence probe DAR4M-AM(5 μM)for 30 min.×1 PBS wash was provided, and the sprouting edges on the vascular bed were chosen for imaging. The images were captured using Olympus microscope attached with DP71 camera. The representative phase contrast and DAR images are provided. Control and DEAN images were magnified to highlight NO hot spots in the sprouting tips. b DAR-nitric oxide hot spots, which represent equivalent eNOS localization, were counted manually as a double-blinded study, and the graph is plotted. Nitric oxide hot spots were found to be significantly increased under DEAN treatment (**p<0.001 vs control), whereas NO hot spots were decreased when observed under L-NAME and cPTIO (##p<0.05 vs control). Combination treatment of DEAN could recover back the L-NAME-mediated inhibitory action (##p<0.05 vs L-NAME). (Color figure online)
Fig. 5
Fig. 5
Chick aortic ring sprouting analysis: a 12-day-old chick embryo was killed, and aortas were cut into small pieces. The aortas were placed between the Matrigel, and drug treatment (DEAN, L-NAME, L-NAME + DEAN and cPTIO) was provided in the media. Angiogenic parameters such as number of rings [10], length and size of the tubule, and number of junctions were quantified and plotted (n ≥ 3). b Significant increase in ring and junction number was quantified under DEAN treatment compared with control, whereas L-NAME and cPTIO decreased the number of rings and junction compared with control (n ≥ 3, **p<0.001 vs control and #p<0.05 vs L-NAME). c DEAN treatment increased the tip cell length and size, whereas L-NAME and cPTIO treatment decreased the tip cell length and size. Combination treatment of DEAN could recover back the L-NAME-mediated inhibitory effect. Values are represented as mean for each group ±SEM (n>3, **p<0.001 vs control and #p<0.05 vs L-NAME). d The chick aortic ring experiment was performed as described in “Materials and methods” section. During the tip sprout initiation, the chick aortas were tracked for 3 h at an interval of 5 min, for DEAN and cPTIO, the treatment was provided every 30 min, and the images were captured. The tubule length and the angle were calculated using ImageJ software. e, f Compared to control, the tubule length and angle were increased under DEAN treatment, whereas the tubule length and angle were decreased under cPTIO (n>3, **p<0.001 vs 0 h DEAN, cPTIO)
Fig. 6
Fig. 6
eNOS localization in tip cell: ac eNOS immunofluorescence imaging shows that eNOS expression is high in tip cells and at the apex of the tip cells. eNOS hot spots were found to be more at the tip of the tip cells (yellow arrow) than the stalk cells (white arrow). Nuclear staining was done using DAPI (blue color). d Representative graph shows that within the tip cell, eNOS is highly enriched in the tip of the tip cell (n ≥ 3, *p<0.05 vs number of eNOS +ve tips). Tip cells which contain eNOS hot spots at the apex of the tip cells were defined as eNOS +ve tips and which do not have eNOS hot spots at the apex of the tip cells were defined as eNOS −ve tips. Based on the eNOS hot spots at the apex of the tip cells, eNOS +ve tip cells and eNOS −ve tip cells were manually counted as a double-blinded study. Almost 200 cells were chosen, and eNOS +ve and −ve tips were counted and plotted. e Fluorescence microscopic results showed the peri-nuclear progressive eNOS (Golgi) localization pattern in tip cells and retrograde eNOS (Golgi) localization pattern in stalk cells. eNOS localization above the nucleus is defined as progressive, and below the nucleus is defined as retrograde. f Representative graph shows significant increase in tip cell number toward progressive end (n ≥ 3, *p<0.001 vs tip cells progressive and #p<0.001 vs tip cell retrograde). g Immunofluorescence (eNOS) images were captured, and 50 images were processed in MATLAB software for image analysis. Pseudo-color was assigned to the bright field eNOS image to analyze the eNOS pattern in tip cells and stalk cells. h Graphical results showed high eNOS intensity in tip cells compared with that in neighboring stalk cells (n ≥ 3, **p<0.001 vs tip cells). (Color figure online)
Fig. 7
Fig. 7
eNOS promotes tip cell formation: a Tip cells were fixed using 2 % paraformaldehyde and scanned using atomic force microscopy. AFM image results showed more filopodial extensions in BPAEC, less filopodial extensions in T24/ECV 304 eNOS-GFP, whereas no filopodia in eNOS-null T24/ECV 304. Yellow color arrow mark indicates the filopodial extensions. b, c At 36 h of transfection, the number of tip cells formed under both control siRNA and eNOS siRNA transfections were counted and plotted. Tip cell (indicated in yellow color arrow mark) number was significantly decreased under eNOS siRNA-transfected EA.hy926 cells than non-transfected EA.hy926 cells (n = 3, *p = 0.01 vs control). d Representative Western blot results showed the transient knockdown of eNOS under eNOS siRNA treatment. e Control siRNA and eNOS siRNA protein expression levels were measured in three different sets of experiment (**p<0.001 vs control siRNA). f Wild type and eNOS KO−/− mice aortas were cut into small pieces and placed between the Matrigel. After 48 h drug treatment, the images were captured in ×4 magnification using inverted microscope. Yellow color arrow mark indicates the tip cell sprouting. g Endothelial identity was imaged using endocan (red), nucleus stain was done using DAPI (blue), and their merged image is shown. Yellow color arrow mark indicates the tip cell sprouting. h, i EA.hy926 cells were allowed to form tip cells under DEAN, CSP, L-NAME, and cPTIO. Significant increase in tip cell number was observed under DEAN treatment, and similarly significant decrease in tip cell number was observed under CSP drug treatment. L-NAME and cPTIO reduced the tip cell formation (n = 3, *p<0.05 vs control). (Color figure online)
Fig. 8
Fig. 8
cGMP live imaging using FlincG and NO downstream pathway dissection: a EA.hy926 cells were electroporated with FlincG-GFP plasmid and allowed to form tip cells on the Matrigel-coated coverslips. After 36 h of transfection, the cells were treated with 10 μM of DEAN and live images were taken using fluorescence microscope. Representative images of phase + vector control and phase + FlincG transfected cells. Yellow arrow mark denotes tip cells, and white arrow mark denotes stalk cells. b Representative image shows that cGMP level was found to be high in the budding tip cell (yellow arrow). c cGMP fluorescence intensity calculations were analyzed using Adobe Photoshop 7.0. Tip cells showed high fluorescence intensity than stalk cells. The images are representative of ten different culture plates (n>3; *p = 0.002 vs tip cells). d Compared to control, significant increase in tip cell number was observed under 8-Br-cGMP and SC (n = 3, *p<0.05 vs control). e After 4 h of cell seeding, EA.hy926 cells were treated with NO downstream pharmacological inhibitors such as KT, ODQ, and MLCKi, and the number of tip cells was counted manually. Statistically significant decrease in tip cell number was observed under KT, ODQ, and MLCKi, whereas combination of NO donor DEAN, with the above-said inhibitors showed significant increase in tip cell sprouting (n = 3; *p<0.05 vs control, #p<0.001 vs control). (Color figure online)
Fig. 9
Fig. 9
Calcium imaging in tip cells: a After 24 h of tip cell formation, EA.hy926 cells were incubated with 10 μM fura 2-AM dye for 30 min, followed by 30 min of washing in fura-free buffer. Images were acquired with the help of ANDOR CCD camera Luca-r attached with Olympus IX71, controlled through Andor IQ software (ANDOR technologies, USA). Bradykinin-induced calcium rise was measured by applying 1 μM of bradykinin. bd Immunofluorescence imaging of P-eNOS and caveolin. BAECs were allowed to form tip cells. The cells were fixed, permeabilized, and incubated with P-eNOS ser 1177 primary antibody. b Active P-eNOS spots were observed in tip cells compared with that in stalk cells. c P-eNOS expression was found to be dominant at the apex of the tip cell (yellow arrow). d Immunofluorescence for both eNOS (red) and caveolin (green) was done, and the images were captured. Nuclear stain was done using DAPI (blue). The merged image demonstrates colocalization of eNOS and caveolin. (Color figure online)

References

    1. Pyriochou A, Zhou Z, Koika V, Petrou C, Cordopatis P, Sessa WC, Papapetropoulos A. The phosphodiesterase 5 inhibitor sildenafil stimulates angiogenesis through a protein kinase G/MAPK pathway. J Cell Physiol. 2007;211:197–204. - PubMed
    1. Gerhardt H, Golding M, Fruttiger M, Ruhrberg C, Lundkvist A, Abramsson A, Jeltsch M, Mitchell C, Alitalo K, Shima D, Betsholtz C. VEGF guides angiogenic sprouting utilizing endothelial tip cell filopodia. J Cell Biol. 2003;161:1163–1177. - PMC - PubMed
    1. Strasser GA, Kaminker JS, Tessier-Lavigne M. Microarray analysis of retinal endothelial tip cells identifies CXCR4 as a mediator of tip cell morphology and branching. Blood. 2010;115:5102–5110. - PubMed
    1. Suchting S, Freitas C, le Noble F, Benedito R, Bréant C, Duarte A, Eichmann A. The notch ligand delta-like 4 negatively regulates endothelial tip cell formation and vessel branching. Proc Natl Acad Sci USA. 2007;104:3225–3230. - PMC - PubMed
    1. Tammela T, Zarkada G, Wallgard E, Murtomäki A, Suchting S, Wirzenius M, Waltari M, Hellström M, Schomber T, Peltonen R, Freitas C, et al. Blocking VEGFR-3 suppresses angiogenic sprouting and vascular network formation. Nature. 2008;454:656–660. - PubMed

Publication types

LinkOut - more resources