. 2015 Feb;8(2):169-81.
doi: 10.1242/dmm.017285. Epub 2014 Dec 15.

HIF-1α restricts NF-κB-dependent gene expression to control innate immunity signals

Affiliations

HIF-1α restricts NF-κB-dependent gene expression to control innate immunity signals

Daniel Bandarra et al. Dis Model Mech. 2015 Feb.

Abstract

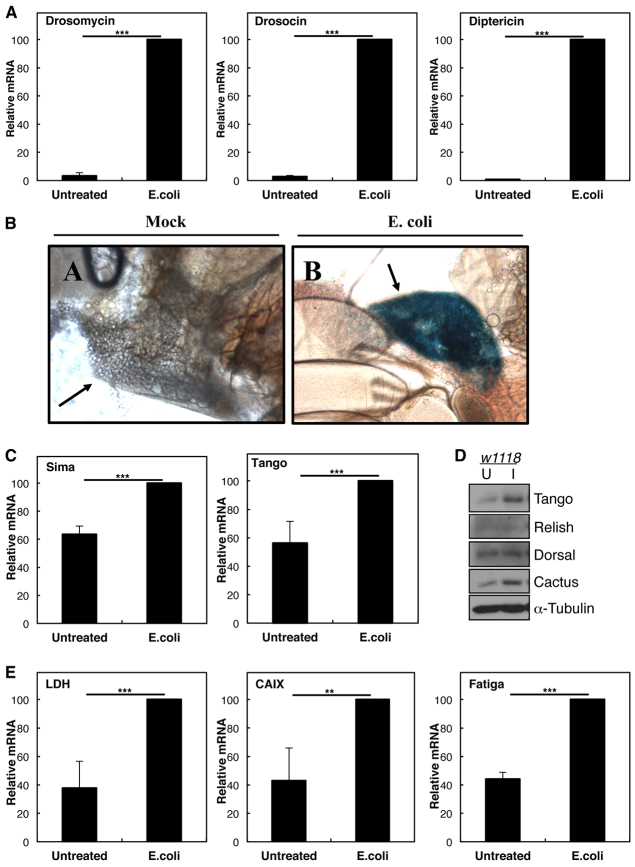
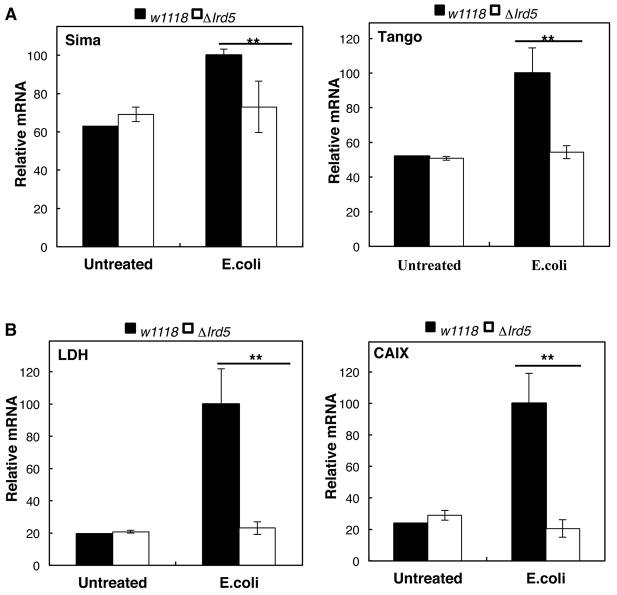
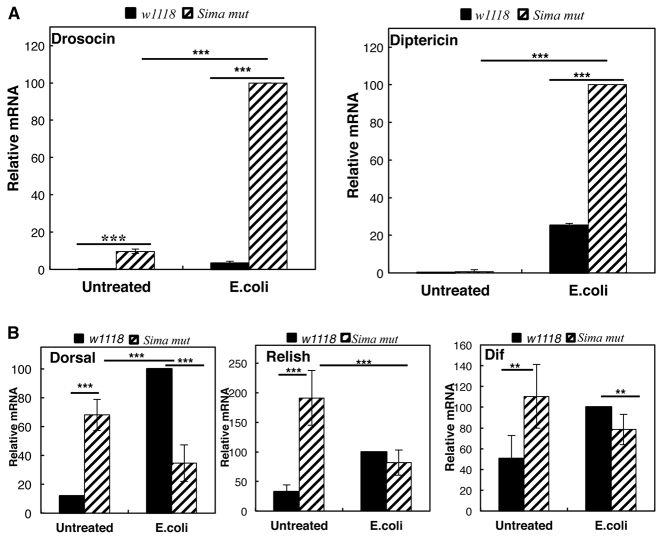
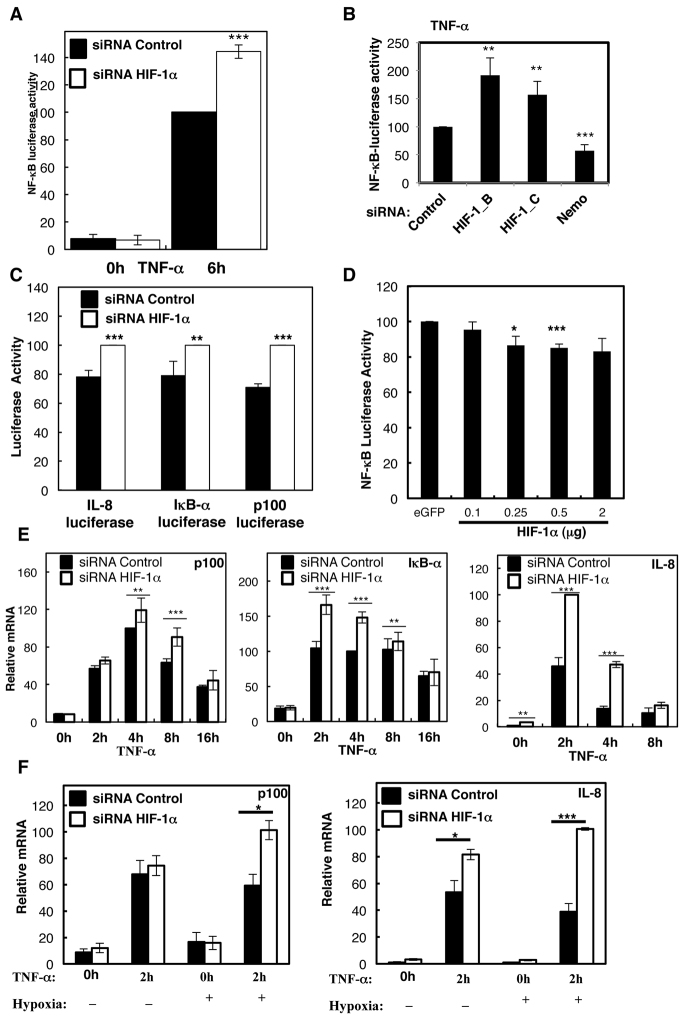
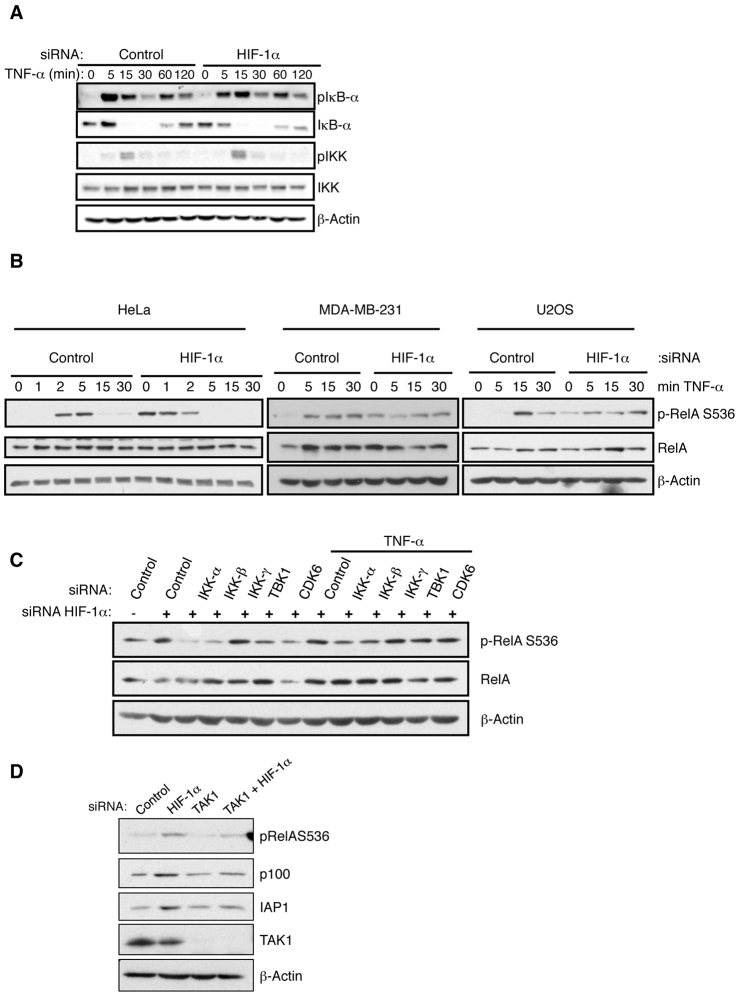
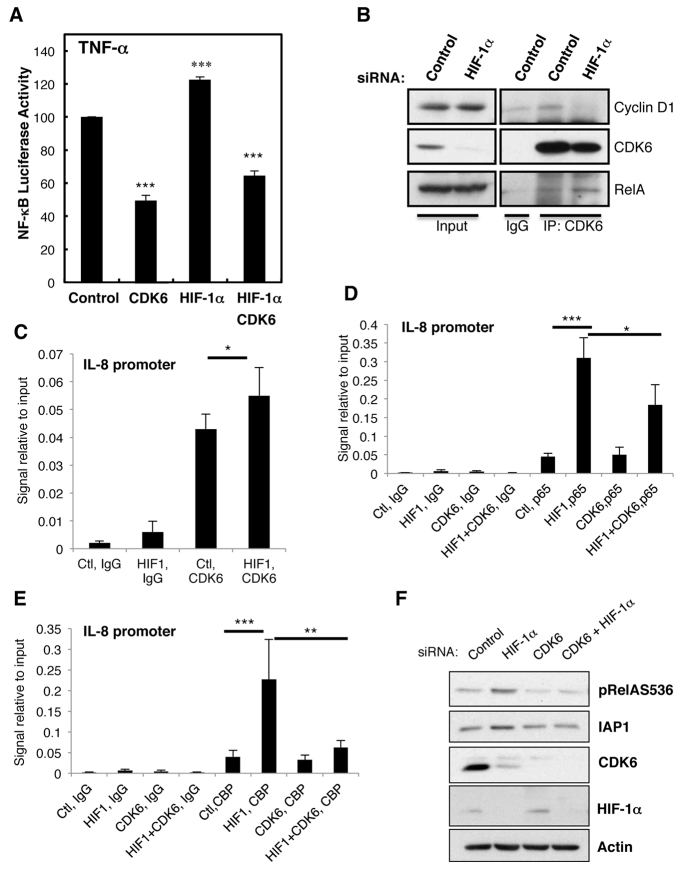
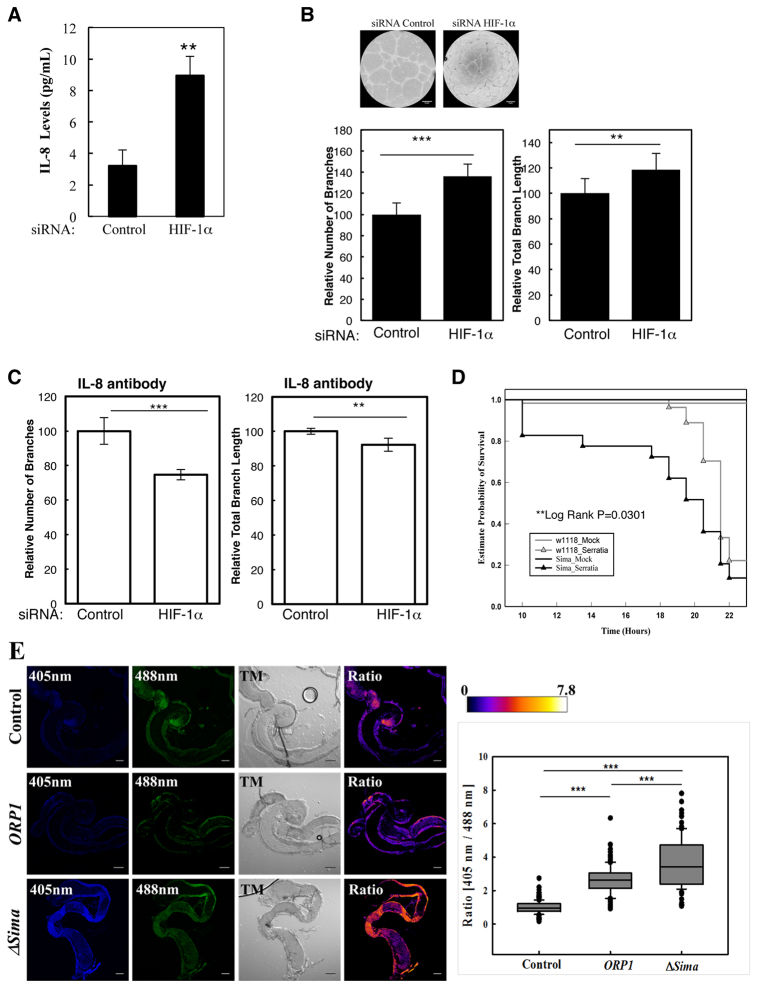
Hypoxia and inflammation are intimately linked. It is known that nuclear factor κB (NF-κB) regulates the hypoxia-inducible factor (HIF) system, but little is known about how HIF regulates NF-κB. Here, we show that HIF-1α represses NF-κB-dependent gene expression. HIF-1α depletion results in increased NF-κB transcriptional activity both in mammalian cells and in the model organism Drosophila melanogaster. HIF-1α depletion enhances the NF-κB response, and this required not only the TAK-IKK complex, but also CDK6. Loss of HIF-1α results in an increased angiogenic response in mammalian cancer cells and increased mortality in Drosophila following infection. These results indicate that HIF-1α is required to restrain the NF-κB response, and thus prevents excessive and damaging pro-inflammatory responses.

Keywords: Drosophila; HIF-1; Hypoxia; IKK; Inflammation; NF-κB.


Figures

Fig. 1.
Fig. 1.
NF-κB-mediated regulation of the HIF pathway is conserved in Drosophila. (A) Third instar larvae were infected with E. coli and left for 2 h at 25°C before lysis. Total RNA was extracted from the whole body of control larvae, and RT-qPCR was performed to determine the levels of drosomycin, drosocin and diptericin in untreated or infected flies. (B) Fat body tissue sections from young adult flies (arrows) reported by β-gal staining of diptericin-lacz. Panel A, mock infection. Panel B, E. coli infection. (C,E) As A, but levels of sima, tango (C), ldh, fatiga and caix (E) were measured in untreated or infected flies. (D) Protein was extracted from the whole body of larvae and analysed by western blotting using the indicated antibodies. The graph shows the relative levels of specific mRNA transcripts normalised to actin mRNA levels, quantified relative to infected flies. The means+s.d. were determined from three independent experiments. Student’s t-test analysis was performed *P≤0.05, **P≤0.01, ***P≤0.001.
Fig. 2.
Fig. 2.
IKK-dependence of HIF activation by inflammation is conserved in vivo. Third instar larvae were infected with E. coli and left for 2 h at 25°C before to lysis. Total RNA was extracted from the whole body of control (w1118) or IKK loss-of-function (ΔIrd5) larvae, and RT-qPCR was performed to determine the levels of sima and tango (A), and ldh and caix (B) in untreated or infected flies. The graph shows the relative levels of specific mRNA transcripts normalized to actin mRNA levels. The means+s.d. were determined from three independent experiments. Student’s t-test analysis was performed *P≤0.05, **P≤0.01, ***P≤0.001. See also supplementary material Fig. S1.
Fig. 3.
Fig. 3.
Role of HIF in the immune response of Drosophila. Third instar larvae were infected with E. coli and left for 2 h at 25°C before lysis. Total RNA was extracted from the whole body of control (w1118) or HIF-α loss-of-function larvae (sima07607), and RT-qPCR was performed to determine the levels of drosocin and diptericin (A) and dorsal, relish and dif (B) in untreated or infected flies. The graph shows the relative levels of specific mRNA transcripts normalised actin mRNA levels. The means+s.d. were determined from three independent experiments. Student’s t-test analysis was performed *P≤0.05, **P≤0.01, ***P≤0.001. See also supplementary material Fig. S2.
Fig. 4.
Fig. 4.
Regulation of the NF-κB pathway by HIF is conserved in mammalian cells. (A,B) HeLa cells that had been stably transfected with a κB luciferase reporter were transfected with an siRNA control or siRNA against HIF-1α (with different siRNA oligonucleotides, denoted by B and C) or Nemo. Cells were treated with 10 ng/ml TNF-α for the 6 h prior to luciferase measurements. All the values were normalised to the control with TNF-α. (C) HEK293 cells that had been stably transfected with IL-8, IκB-α and p100 luciferase reporter constructs were transfected with a control siRNA or an siRNA against HIF-1α and then treated with TNF-α for 8 h before luciferase measurements. All the values were normalised to the maximum value of luciferase activity obtained. The graphs depict means+s.d. determined from four independent experiments. Student’s t-test analysis was performed *P≤0.05, **P≤0.01, ***P≤0.001. (D) HeLa κB cells were transfected with the indicated concentrations of HIF-α plasmid or empty vector. Cells were treated with TNF-α for 6 h, and the luciferase activity was measured. The values were normalised to the control. (E) HeLa cells were transfected with an siRNA control or an siRNA against HIF-1α. mRNA was extracted, and RT-qPCR was performed for the indicated gene transcripts. The graphs show the relative levels of specific mRNA transcripts normalised to actin mRNA levels. The means+s.d. were determined from four independent experiments. Student’s t-test analysis was performed *P≤0.05, **P≤0.01, ***P≤0.001. (F) As in E, but where indicated cells were treated with 1% O2 (−hypoxia) for 30 min before the addition of 10 ng/ml TNF-α for an additional 2 h before RNA extraction. See also supplementary material Fig. S3.
Fig. 5.
Fig. 5.
HIF knockdown induces TAK-IKK activity. (A) HeLa cells were transfected with an siRNA control or an siRNA against HIF-1α and then treated with 10 ng/ml of TNF-α for the indicated times. Whole-cell lysates were prepared and analysed by western blotting for the indicated proteins (‘p’ prefix denotes phosphorylated protein). (B) HeLa, MDA-MB-231 and U2OS were transfected with an siRNA control or an siRNA against HIF-1α and treated with TNF-α for the indicated times. Whole-cell lysates were prepared and analysed by western blotting for the indicated proteins. (C) HeLa cells were transfected with the indicated siRNA oligonucleotides before treatment with TNF-α for 30 min before harvest. Whole-cell lysates were analysed by western blotting for the depicted proteins. (D) HeLa cells were transfected with the indicated siRNA oligonucleotides before harvest. Whole-cell lysates were analysed by western blotting for the indicated proteins. See also supplementary material Fig. S4.
Fig. 6.
Fig. 6.
HIF de-repression of NF-κB activity requires CDK6. (A) HeLa-κB cells were co-transfected with the indicated siRNA for 48 h. Cells were treated with TNF-α for 6 h, and the luciferase activity was measured. The means+s.d. were determined from three independent experiments. Student’s t-test analysis was performed *P≤0.05, **P≤0.01, ***P≤0.001. (B) HeLa cells were transfected with control or HIF-1α siRNA oligonucleotides for 48 h before lysis. To immunoprecipitate CDK6, 200 μg of protein was used. Normal rabbit IgG was used as a control. Immunoprecipitated complexes were analysed by western blotting using the indicated antibodies. Inputs correspond to 10% of material. (C) HeLa cells were transfected with control (Ctl) and HIF-1α (HIF1) siRNA oligonucleotides for 48 h before treatment with 10 ng/ml TNF-α for 1 h. Cells were fixed and lysed, and chromatin immunoprecipitation assays were performed using the indicated antibodies. Purified DNA was analysed by using qPCR with primers for the IL-8 promoter. The graph depicts means+s.d. from three independent experiments. Student’s t-test analysis was performed *P≤0.05, **P≤0.01, ***P≤0.001. (D,E) HeLa cells were transfected with control (Ctl), HIF-1α (HIF1), CDK6 (CDK6) or HIF-1α and CDK6 (HIF1+CDK6) siRNA oligonucleotides for 48 h before treatment with 10 ng/ml TNF-α for 1 h. Cells were processed and analysed as in C. The graph depicts means+s.d. from three independent experiments. Student’s t-test analysis was performed *P≤0.05, **P≤0.01, ***P≤0.001. (F) HeLa cells were transfected with control, HIF-1α, CDK6 or HIF-1α and CDK6 siRNA oligonucleotides for 48 h before lysis. Whole-cell lysates were analysed by western blotting for the indicated proteins. See also supplementary material Fig. S5.
Fig. 7.
Fig. 7.
HIF-1α depletion results in increased angiogenesis in cancer cells and enhanced mortality following infection in Drosophila. (A) IL-8 protein levels were measured in the medium that had been derived from HeLa cells transfected with control or HIF-1α siRNA oligonucleotides for 48 h. The graph depicts the means and standard error of the mean from three independent experiments. (B) HUVEC cells were used to produce endothelial tubes and then incubated with medium derived from HeLa cells transfected with control or HIF-1α siRNA oligonucleotides for 48 h. Example images are shown and the graphs depict mean+s.d. from three independent experiments, where the number of branches and total branch length were measured. Student’s t-test analysis was performed *P≤0.05, **P≤0.01, ***P≤0.001. (C) HUVECs were treated as described in B, but medium was incubated with an antibody against IL-8 for 2 h before being used. The graphs depict mean+s.d. from three independent experiments, where the number of branches and total branch length were measured. (D) Wild-type adult flies (w1118) and HIF-α loss-of-function flies (sima07607) were pricked using a thin needle dipped in a diluted overnight culture of Serratia marcescens Db10 (OD600=0.2) or in a saline solution (Mock). Groups of 60 to 80 flies were used and kept at room temperature. Survival was monitored and expressed as the ‘estimated probability of survival’. The P-value was obtained from log-rank statistical analysis. (E) H2O2 sensing by ICMT flies (Control), roGFP2-ORP1 (ORP1) and Sima loss-of-function roGFP2-ORP1 (ΔSima) transgenic flies was analysed 6 h following infection with Serratia marcescens. TM, transillumination or bright field. Images were acquired using a Zeiss confocal microscope and analysed using ImageJ. The ratio image was obtained by dividing the 405-nm image by the 488-nm image pixel by pixel and displayed in false colours using the lookup table Fire (arbitrary units). The values obtained were imported into Sigma-Plot software, which was used to generate box and whisker plots. In the plot, the middle line shows the median value, the bottom and top lines represent the lower and upper quartiles. Whiskers extend to 10th and 90th percentiles and all the outliers are shown. Quantification was performed using ten adult flies in two independent experiments, +s.d. Scale bars: 100 μm. Student’s t-test analysis was performed *P≤0.05, **P≤0.01, ***P≤0.001. See also supplementary material Fig. S6.

References

    1. Adli M., Baldwin A. S. (2006). IKK-i/IKKepsilon controls constitutive, cancer cell-associated NF-kappaB activity via regulation of Ser-536 p65/RelA phosphorylation. J. Biol. Chem. 281, 26976–26984. - PubMed
    1. Albrecht S. C., Barata A. G., Grosshans J., Teleman A. A., Dick T. P. (2011). In vivo mapping of hydrogen peroxide and oxidized glutathione reveals chemical and regional specificity of redox homeostasis. Cell Metab. 14, 819–829. - PubMed
    1. Arquier N., Vigne P., Duplan E., Hsu T., Therond P. P., Frelin C., D’Angelo G. (2006). Analysis of the hypoxia-sensing pathway in Drosophila melanogaster. Biochem. J. 393, 471–480. - PMC - PubMed
    1. Ashall L., Horton C. A., Nelson D. E., Paszek P., Harper C. V., Sillitoe K., Ryan S., Spiller D. G., Unitt J. F., Broomhead D. S., et al. (2009). Pulsatile stimulation determines timing and specificity of NF-kappaB-dependent transcription. Science 324, 242–246. - PMC - PubMed
    1. Bandarra D., Biddlestone J., Mudie S., Muller H. A., Rocha S. (2014). Hypoxia activates IKK-NF-κB and the immune response in Drosophila melanogaster. Biosci. Rep. 34, e00127. - PMC - PubMed

Publication types

MeSH terms