. 2014 Dec 16:5:5495.
doi: 10.1038/ncomms6495.

Transposable element islands facilitate adaptation to novel environments in an invasive species

Affiliations

Transposable element islands facilitate adaptation to novel environments in an invasive species

Lukas Schrader et al. Nat Commun. .

Abstract

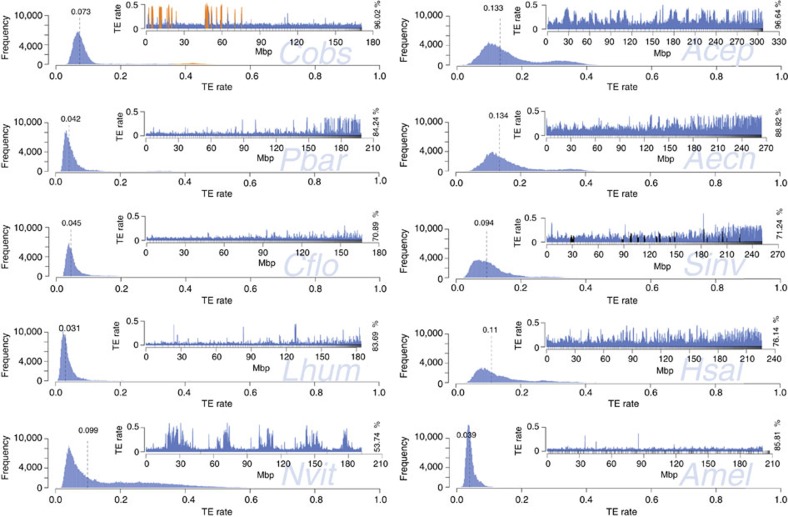
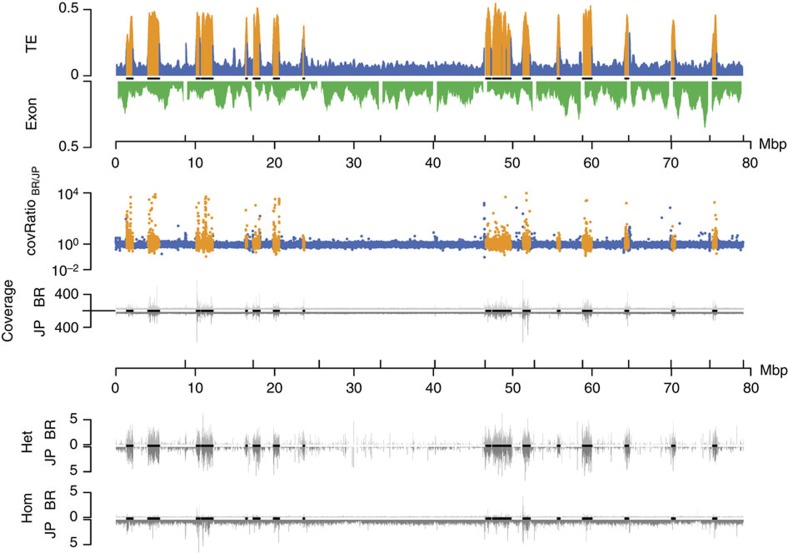
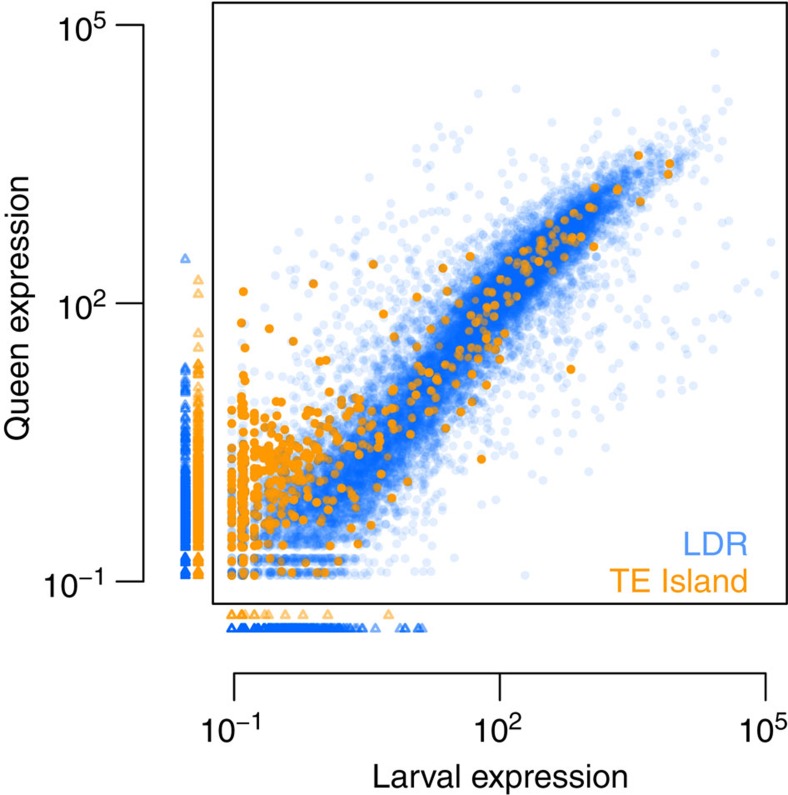
Adaptation requires genetic variation, but founder populations are generally genetically depleted. Here we sequence two populations of an inbred ant that diverge in phenotype to determine how variability is generated. Cardiocondyla obscurior has the smallest of the sequenced ant genomes and its structure suggests a fundamental role of transposable elements (TEs) in adaptive evolution. Accumulations of TEs (TE islands) comprising 7.18% of the genome evolve faster than other regions with regard to single-nucleotide variants, gene/exon duplications and deletions and gene homology. A non-random distribution of gene families, larvae/adult specific gene expression and signs of differential methylation in TE islands indicate intragenomic differences in regulation, evolutionary rates and coalescent effective population size. Our study reveals a tripartite interplay between TEs, life history and adaptation in an invasive species.


Figures

Figure 1
Figure 1. Two workers of C. obscurior and the remains of a fly.
Hidden in small cavities of plants, the inconspicuous colonies of this species are frequently introduced to new habitats by global commerce. In spite of strong genetic bottlenecks, even single colonies with few reproductive individuals suffice to establish stable populations.
Figure 2
Figure 2. Assembly size in Mbp plotted against the relative proportion of exons, introns and different repetitive elements.
The analysed genomes show a negative correlation between relative exon but not intron content. Genome size is positively correlated with relative short simple repeat but not class I and II TE content. A, S. invicta; B, A. cephalotes; C, A. echinatior; D, H. saltator; E, C. floridanus; F, P. barbatus; G, L. humile; H, C. obscurior.
Figure 3
Figure 3. The proportion of bases annotated in TE islands in C. obscurior against the log-scaled total base count in TE islands for each TE superfamily.
Point size is relative to the copy number of the respective element found in TE islands (orange) and in LDRs (blue). Red circles indicate superfamilies with significantly higher frequency in TE islands than other superfamilies. Superfamilies with a significantly higher base count in TE islands are denoted by a red asterisk. e1: Percentage of the genome contained in TE islands (7.18%), e2: median across all types of TEs (13.89%).
Figure 4
Figure 4. Quantitative measures on the divergence of TE islands and LDRs.
(a) Length polymorphism for Class I and Class II TEs in LDRs (blue) and TE islands (orange). U-tests, nLDR=54,950, nTE=6,466 for class I and nLDR=59,054, nTE=6,813 for class II. (b) Deviations from the median coverage ratio calculated for 1 kb windows in LDRs (blue) and TE islands (orange). U-test, nLDR=157,296; nTE=12,165. (c) Log2-scaled density plots of the coverage for all homozygous (solid black lines) and heterozygous SNV (dotted red lines) calls divided by the median coverage (orange, calls within TE islands; blue, calls in LDRs). Coverage at homozygous calls is not different from the median overall coverage, neither in TE islands nor in LDRs. The shift for heterozygous SNV calls within TE islands shows that most calls result from diverging duplicated loci. The bimodal distribution for heterozygous calls in other genomic regions suggests two distinct populations of SNV calls, that is, true heterozygous loci (first peak) and diverging sequence in duplicated loci (second peak). (d) Bit scores for genes in LDRs (blue) and TE islands (orange) retrieved by BLASTx against annotated proteins from seven ant genomes. U-test, nLDR=12,065; nTE=902. (e) Rates of non-synonymous substitutions (calculated as dN/(dN+dS)) in LDR (blue) and TE island genes (orange). U-test, nLDR=6,806; nTE=423. (f) Exon-wide CpG o/e values were plotted against the expression rank from 0 (least expressed) to 100 (most expressed) genes for LDRs (blue) and TE islands (orange). (g) Calculated ratios (BR/JP) for exon CpG o/e values in LDRs (blue) and TE islands (orange). F-test, nLDR=16,379; nTE=1,159. (***P<0.0001, boxplots show the median, interquartile ranges (IQR) and 1.5 IQR.).
Figure 5
Figure 5. Frequency and distribution (insert plots) of TE content in 200 kb windows.
Frequency plots: dashed lines denote median TE content. Distribution plots: different proportions of total draft genome sequence were analysed (in %), depending on assembly quality. Scaffolds are sorted by size, small upward tick marks indicate scaffold boundaries. For C. obscurior, regions defined as TE islands are coloured in orange. For S. invicta, scaffolds mapping to a non-recombining chromosomal inversion73 are shown in black. For A. mellifera, scaffolds were sorted according to linkage group.
Figure 6
Figure 6. Genomic divergence and subgenomic structure of the 12 largest C. obscurior genome scaffolds (including all 18 TE islands).
High TE content in TE islands correlates with deviations from the average coverage ratio, very high absolute coverage in both lineages and high numbers of SNV calls. First track: relative TE (blue and orange within TE islands) and exon content (green) per 200 kb. Second track: coverage ratio BR/JP (blue and orange within TE islands). Third track: absolute coverage for BR (top) and JP (bottom). Fourth track: heterozygous SNV calls per kb in BR (top) and JP (bottom) relative to the reference genome. Fifth track: homozygous SNV calls per kb in BR (top) and JP (bottom) relative to the reference genome. Black lines on x axes indicate localization of TE islands.
Figure 7
Figure 7. Mean normalized expression in third instar queen larvae and mated adult queens for all Cobs1.4 genes.
Small triangles indicate genes with no expression in queens (plotted below the x axis) or larvae (plotted left to the y axis). Ninety-five TE island genes and 1,382 LDR genes were not expressed at all (orange, TE island genes; blue, LDR genes).

References

    1. Charlesworth D. & Charlesworth B. Inbreeding depression and its evolutionary consequences. Annu. Rev. Ecol. Syst. 18, 237–268 (1987).
    1. Lynch M. The Origins of Genome Architecture Sinauer Associates Inc (2007).
    1. Charlesworth D. & Wright S. I. Breeding systems and genome evolution. Curr. Opin. Genet. Dev. 11, 685–690 (2001). - PubMed
    1. Romiguier J. et al. Population genomics of eusocial insects: the costs of a vertebrate-like effective population size. J. Evol. Biol. 27, 593–603 (2014). - PubMed
    1. McDonald J. H. & Kreitman M. Adaptive protein evolution at the Adh locus in Drosophila. Nature 351, 652–654 (1991). - PubMed

Publication types

Substances

Associated data

LinkOut - more resources