. 2014 Dec 16:14:131.
doi: 10.1186/1471-2288-14-131.

Visualizing inconsistency in network meta-analysis by independent path decomposition

Affiliations

Visualizing inconsistency in network meta-analysis by independent path decomposition

Ulrike Krahn et al. BMC Med Res Methodol. .

Abstract

Background: In network meta-analysis, several alternative treatments can be compared by pooling the evidence of all randomised comparisons made in different studies. Incorporated indirect conclusions require a consistent network of treatment effects. An assessment of this assumption and of the influence of deviations is fundamental for the validity evaluation.

Methods: We show that network estimates for single pairwise treatment comparisons can be approximated by the evidence of a subnet that is decomposable into independent paths. Path-based estimates and the estimate of the residual evidence can be used with their contribution to the network estimate to set up a forest plot for the consistency assessment. Using a network meta-analysis of twelve antidepressants and controlled perturbations in the real and constructed consistent data, we discuss the consistency assessment by the independent path decomposition in contrast to an approach using a recently presented graphical tool, the net heat plot. In addition, we define influence functions that describe how changes in study effects are translated into network estimates.

Results: While the consistency assessment by the net heat plot comprises all network estimates, an independent path decomposition and visualisation in a forest plot is tailored to one specific treatment comparison. It allows for the recognition as to whether inconsistencies between different paths of evidence and outlier effects do affect the considered treatment comparison.

Conclusions: The approximation of the network estimate for a single comparison by the evidence of a subnet and the visualisation of the decomposition into independent paths provide the applicability of a graphical validation instrument that is known from classical meta-analysis.


Figures

Figure 1
Figure 1
Evidence network of the antidepressants example. The lines display the observed treatment comparisons. The thickness of a line is proportional to the inverse standard error of the directly estimated treatment effect, which is aggregated over all studies including the two respective treatments.
Figure 2
Figure 2
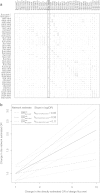
Influence analysis in the antidepressants example. a) Visualised H matrix: The contribution of the direct estimate of one design in the column to a network estimate in the row is shown by the area of the corresponding gray square. The two contrasts of the two three-armed studies with design fluo:paro:sert are marked by . A design whose direct evidence contributes greatly to the network estimate of some other designs is framed. b) Three exemplary influence functions: The influence of direct evidence of design fluo:venl on the network estimates with designs fluo:venl (dashed line), sert:venl (solid line), and fluo:paro (dashed and dotted line) and their corresponding 95% confidence intervals (dotted lines) is shown.
Figure 3
Figure 3
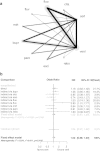
Approximation by independent path decomposition for network estimate of comparison sert:venl in the antidepressants example. a) Approximating decomposable subnet. The thickness of a gray line is proportional to the inverse standard error of the corresponding directly estimated treatment effect. The thickness of a black line represents the contribution of direct evidence to network estimate sert:venl. b) Forest plot of the independent path subnet and the residual evidence.
Figure 4
Figure 4
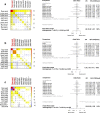
Approximation by independent path decomposition versus net heat plot approach in the constructed examples after perturbing the direct estimates in a) of fluo:venl, in b) of fluo:venl and dulo:esci, and in c) of fluo:venl and fluo:sert (column red marked respectively) by inflating the corresponding OR by a factor of two. Left: Net heat plots in which the area of a gray square displays the contribution of the direct estimate of one design in the column to a network estimate in the row. The colours on the diagonal represent the inconsistency contribution of the corresponding design. The colours on the off-diagonal are associated with the change in inconsistency between direct and indirect evidence in a network estimate in the row after relaxing the consistency assumption for the effect of one design in the column. Blue colours indicate an increase and warm colours a decrease. Only rows and columns of the net heat plots are shown, where the maximal absolute entry exceeds or is equal one. The two contrasts of the three-armed studies are marked by . Right: Forest plots for the network estimate of comparison sert:venl based on the independent path decomposition of Figure 3a in the three constructed examples.
Figure 5
Figure 5
Approximation by independent path decomposition versus net heat plot approach in the antidepressants example after perturbing the red-marked direct estimates in the columns. Left: Net heat plot in which only rows and columns are shown, where the maximal absolute entry exceeds or is equal one. Right: Forest plot for the network estimate of comparison sert:venl.

References

    1. Salanti G. Indirect and mixed-treatment comparison, network, or multiple-treatments meta-analysis: many names, many benefits, many concerns for the next generation evidence synthesis tool. Res Synth Methods. 2012;3(2):80–97. doi: 10.1002/jrsm.1037. - DOI - PubMed
    1. Dias S, Welton NJ, Sutton AJ, Caldwell DM, Lu G, Ades AE. Evidence synthesis for decision making4: inconsistency in networks of evidence based on randomised controlled trials. Med Decis Making. 2013;33:641–656. doi: 10.1177/0272989X12455847. - DOI - PMC - PubMed
    1. Sutton AJ, Higgins JPT. Recent developments in meta-analysis. Stat Med. 2008;27:625–650. doi: 10.1002/sim.2934. - DOI - PubMed
    1. Lewis S, Clarke M. Forest plots: trying to see the wood and the trees. BMJ. 2001;322(7300):1479–1480. doi: 10.1136/bmj.322.7300.1479. - DOI - PMC - PubMed
    1. Salanti G, Marinho V, Higgins JPT. A case study of multiple-treatments meta-analysis demonstrates that covariates should be considered. J Clin Epidemiol. 2009;62(8):857–864. doi: 10.1016/j.jclinepi.2008.10.001. - DOI - PubMed
Pre-publication history
    1. The pre-publication history for this paper can be accessed here:http://www.biomedcentral.com/1471-2288/14/131/prepub

MeSH terms

Substances