. 2014 Dec 16:11:209.
doi: 10.1186/s12974-014-0209-0.

Transient transfection of human CDNF gene reduces the 6-hydroxydopamine-induced neuroinflammation in the rat substantia nigra

Affiliations

Transient transfection of human CDNF gene reduces the 6-hydroxydopamine-induced neuroinflammation in the rat substantia nigra

Rasajna Nadella et al. J Neuroinflammation. .

Abstract

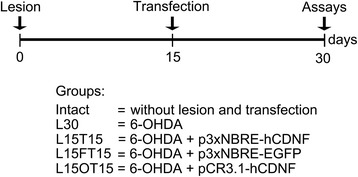
Background: The anti-inflammatory effect of the cerebral dopamine neurotrophic factor (CDNF) was shown recently in primary glial cell cultures, yet such effect remains unknown both in vivo and in 6-hydroxydopamine (6-OHDA) models of Parkinson's disease (PD). We addressed this issue by performing an intranigral transfection of the human CDNF (hCDNF) gene in the critical period of inflammation after a single intrastriatal 6-OHDA injection in the rat.

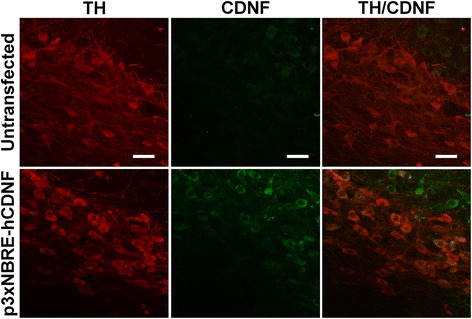
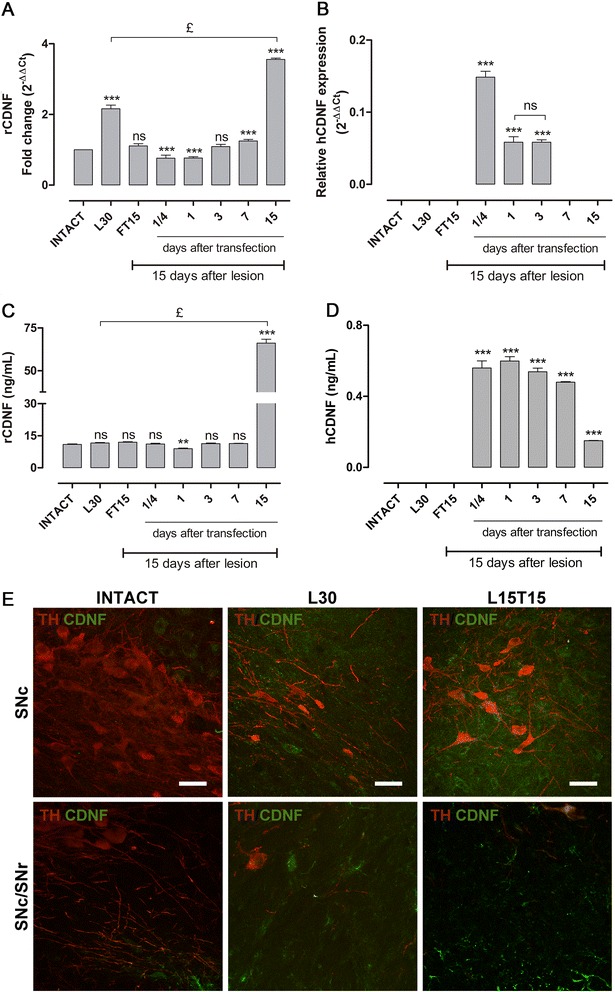
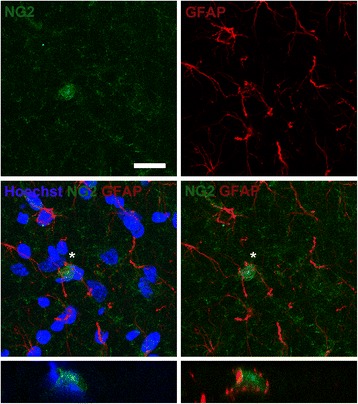
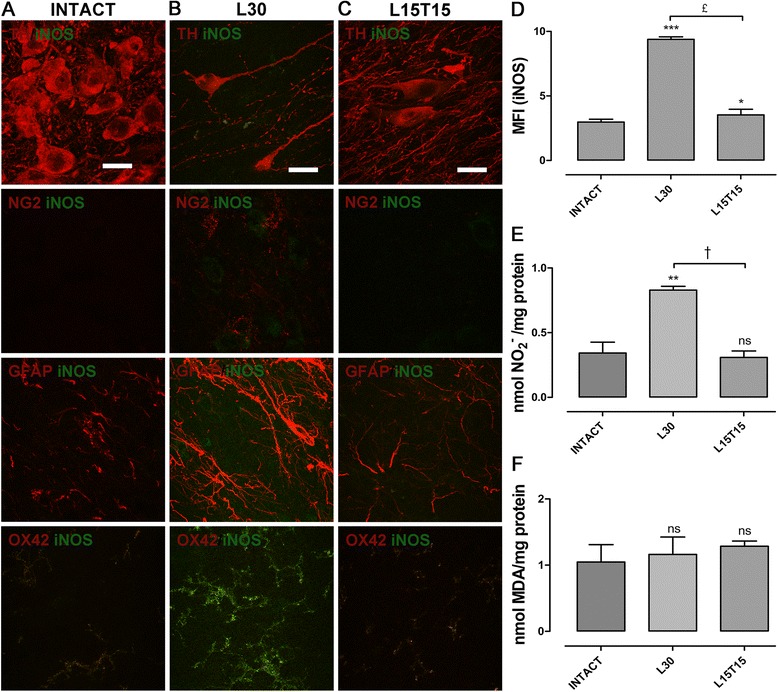
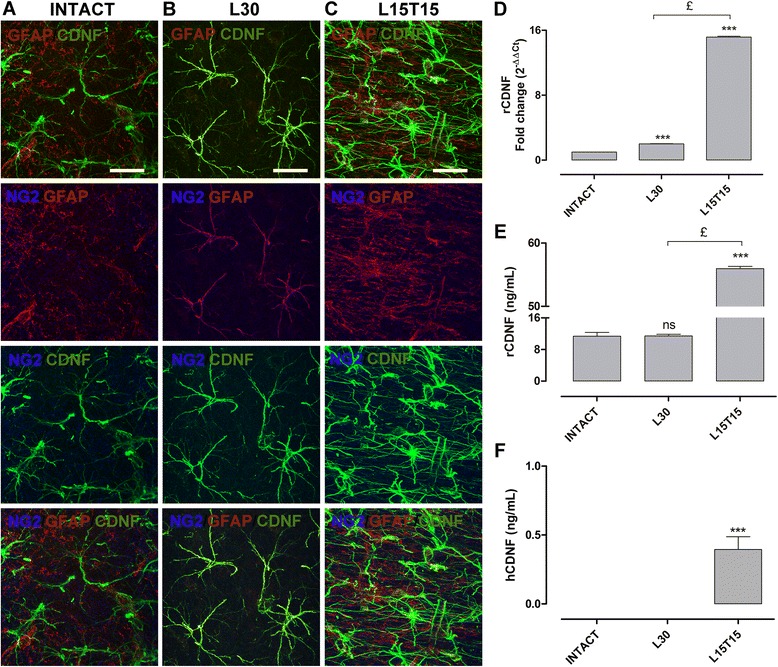
Methods: At day 15 after lesion, the plasmids p3xNBRE-hCDNF or p3xNBRE-EGFP, coding for enhanced green florescent protein (EGFP), were transfected into the rat substantia nigra (SN) using neurotensin (NTS)-polyplex. At day 15 post-transfection, we measured nitrite and lipoperoxide levels in the SN. We used ELISA to quantify the levels of TNF-α, IL-1β, IL-6, endogenous rat CDNF (rCDNF) and hCDNF. We also used qRT-PCR to measure rCDNF and hCDNF transcripts, and immunofluorescence assays to evaluate iNOS, CDNF and glial cells (microglia, astrocytes and Neuron/Glial type 2 (NG2) cells). Intact SNs were additional controls.

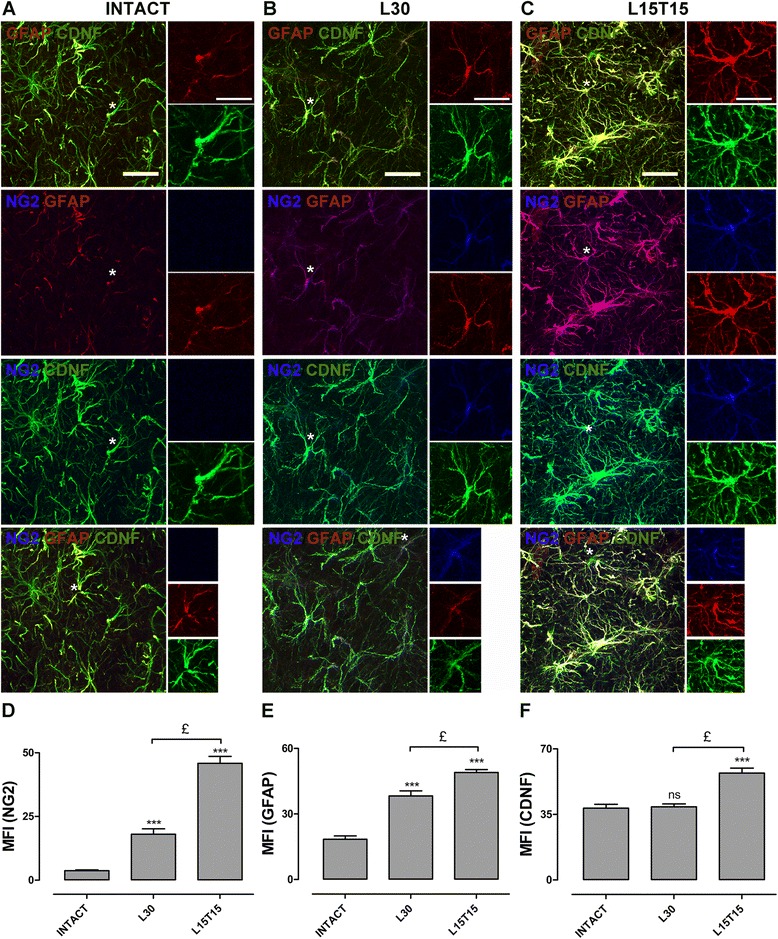
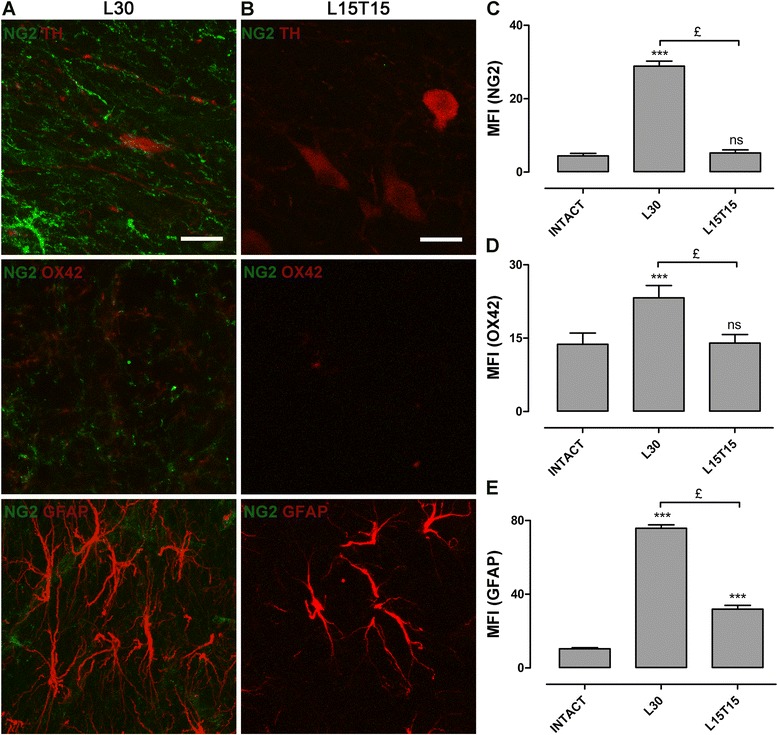
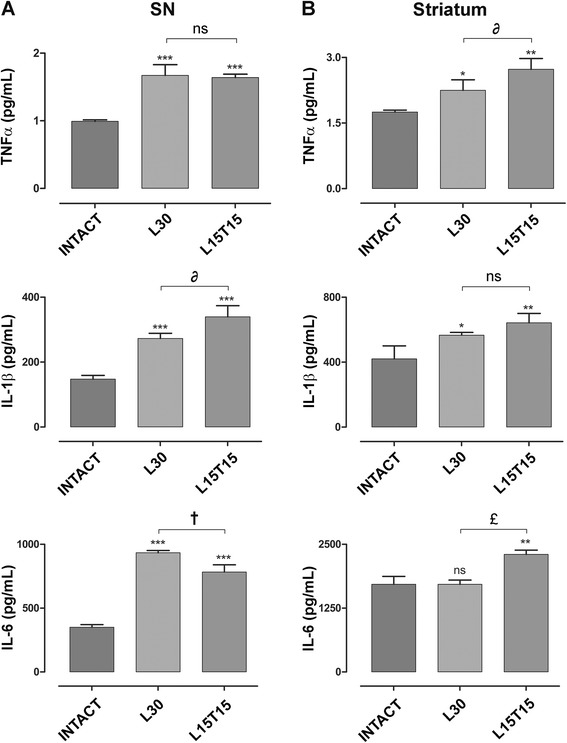
Results: In the SN, 6-OHDA triggered nitrosative stress, increased inflammatory cytokines levels, and activated the multipotent progenitor NG2 cells, which convert into astrocytes to produce rCDNF. In comparison with the hemiparkinsonian rats that were transfected with the EGFP gene or without transfection, 6-OHDA treatment and p3xNBRE-hCDNF transfection increased the conversion of NG2 cells into astrocytes resulting in 4-fold increase in the rCDNF protein levels. The overexpressed CDNF reduced nitrosative stress, glial markers and IL-6 levels in the SN, but not TNF-α and IL-1β levels.

Conclusion: Our results show the anti-inflammatory effect of CDNF in a 6-OHDA rat of Parkinson's disease. Our results also suggest the possible participation of TNF-α, IL-1β and IL-6 in rCDNF production by astrocytes, supporting their anti-inflammatory role.


Figures

Figure 1
Figure 1
Experimental design. At day 0, we injected 6-hydroxydopamine (6-OHDA) into the striatum; at day 15 post-lesion, we transfected either of the mentioned plasmids with neurotensin (NTS)-polyplex into the substantia nigra pars compacta and at day 30 from the beginning of the experiment or at day 15 after the transfection, we extracted the tissues or perfused the animals for molecular and cellular assays.
Figure 2
Figure 2
Presence of total cerebral dopamine neurotrophic factor (CDNF) + cells in intact rat substantia nigra (SN). Representative confocal micrographs showing the immunoreactivity to tyrosine hydroxylase (TH), the rate-limiting enzyme in dopamine synthesis (red) and CDNF (green). TH/CDNF is the overlay of the micrographs in the same row. Untransfected and p3xNBRE-hCDNF transfected tissue slices were from different intact rat brains. The scale bars = 20 μm are common for all the micrographs.
Figure 3
Figure 3
Expression levels of total cerebral dopamine neurotrophic factor (CDNF) in the substantia nigra (SN). Graphs showing the fold change increase in the endogenous, rat (r)CDNF (A) and relative transgene human (h)CDNF (B) transcripts by qRT-PCR. Graphs showing the protein levels of rCDNF (C) and hCDNF (D) by ELISA. First 3 bars in the graphs represent controls and the rest represent the time course of p3xNBRE-hCDNF transfections. FT15 = at day 15 after p3xNBRE-EGFP transfection, ¼ = at 6 hours; 1 = at 24 hours; 3 = at day 3; 7 = at day 7; 15 = day 15, after p3xNBRE-hCDNF transfection in a 15-day lesion rats. (E) Representative merged confocal micrographs showing immunoreactivity to CDNF (green) and tyrosine hydroxylase (TH) (red). The headings refer to mesencephalon slices that were obtained from different rats, intact (INTACT), with 30-day 6-OHDA lesion (L30), and 15 days of lesion and 15 days of transfection (L15T15). The scale bars = 20 μm are common for all the micrographs. ns = not significant. **P < 0.01, ***P < 0.001 when compared with the intact condition. £ = P < 0.001 when compared with L30. One-way ANOVA with Newman-Keuls post hoc test. n = 4 different rats for each condition.
Figure 4
Figure 4
Apparent conversion of NG2 cell into an astrocyte cell in the substantia nigra pars reticulata (SNr) at day 30 after 6-hydroxydopamine (6-ODHA) lesion. Representative confocal micrographs showing nuclei stained with Hoechst (blue) and immunostaining against NG2 (green), and GFAP (red). Individual micrographs of NG2 and GFAP (top row), merged images of Hoechst/NG2/GFAP and NG2/GFAP (middle row) and vertical 1-μm optical slices for the cell indicated by the asterisk (bottom row) are shown. The scale bar = 20 μm is common for all the micrographs. GFAP, glial fibrillary acidic protein; NG2, Neuron/Glial type 2.
Figure 5
Figure 5
Expression of cerebral dopamine neurotrophic factor (CDNF) by astrocytes and astrocyte-like NG2 cells in the substantia nigra pars reticulata (SNr). Representative merged confocal micrographs showing immunoreactivity to CDNF (green), GFAP (red) and NG2 (blue). The triple immune micrographs in the lower row are shown individually in the first three rows with possible combinations of double markers to see more details. The headings refer to mesencephalon slices that were obtained from different rats, intact (A), with 30-day 6-OHDA lesion (B), and 15 days of lesion and 15 days of transfection (C). Asterisk represents the cell whose fluorescent markers are individually displayed in the inserts. Graphs showing the mean fluorescence intensity (MFI) for NG2 (D), GFAP (E) and CDNF (F). The scale bars = 20 μm are common for all the micrographs. ns = not significant. ***P < 0.001 when compared with the intact condition. £ = P < 0.001 when compared with L30. One-way ANOVA with Newman-Keuls post hoc test. n = 4 different rats for each condition. GFAP, glial fibrillary acidic protein; NG2, Neuron/Glial type 2.
Figure 6
Figure 6
Nitrosative and oxidative stress markers in the substantia nigra (SN). Representative merged confocal micrographs showing the presence of inducible nitric oxide synthase (iNOS) + cells (green) with tyrosine hydroxylase (TH) + cells (red) in first row, with NG2+ cells (red) in the second row, with GFAP+ cells (red) in the third row, and with OX42+ cells (red) in the last row in intact (A), in L30 (B) and in L15T15 (C) conditions. Graphs showing the mean fluorescence intensity (MFI) for iNOS (D), the levels of nitrites (E) and malondialdehyde (F). The headings for micrograph panels and x-axis labels for graphs refer to mesencephalon slices that were obtained from different rats, intact, with 30-day 6-hydroxydopamine (6-OHDA) lesion, L30, and 15 days of lesion and 15 days of transfection, L15T15. The scale bars = 20 μm are common for all the micrographs. ns = not significant. *P < 0.05, **P < 0.01, ***P < 0.001 when compared with the intact condition. † = P < 0.01, £ = P < 0.001 when compared with L30. One-way ANOVA with Newman-Keuls post hoc test. n = 4 different rats for each condition. GFAP, glial fibrillary acidic protein; NG2, Neuron/Glial type 2.
Figure 7
Figure 7
Presence of glial cells in the substantia nigra pars compacta (SNc). Representative merged confocal micrographs showing the presence of NG2+ cells (green) with TH+ cells (red, top row), with OX42+ cells (red, middle row), and with GFAP+ cells (red, bottom row) at day 30 after lesion, L30 (A) and at day 15 after transfection with 15 days of lesion, L15T15 (B). Graphs showing the mean fluorescence intensity (MFI) for NG2 (C), OX42 (D) and GFAP (E). The scale bars = 20 μm are common for all the micrographs. ns = not significant. ***P < 0.001 when compared with the intact condition. £ = P < 0.001 when compared with L30. One-way ANOVA with Newman-Keuls post hoc test. n = 4 different rats for each condition. GFAP, glial fibrillary acidic protein; NG2, Neuron/Glial type 2.
Figure 8
Figure 8
Expression levels of total cerebral dopamine neurotrophic factor (CDNF) in the striatum. Representative merged confocal micrographs showing immunoreactivity to CDNF (green), GFAP (red) and NG2 (blue). The triple immune micrographs in the lower row are shown individually in the first three rows with possible combinations of double markers to see more details in intact (A), in L30 (B) and in L15T15 (C) conditions. Graphs showing rCDNF transcripts by qRT-PCR (D) and protein levels of rCDNF (E) and hCDNF (F) by ELISA. The headings for micrograph panels and x-axis labels for graphs refer to mesencephalon slices that were obtained from different rats, intact, with 30-day 6-hydroxydopamine (6-OHDA) lesion, L30, and 15 days of lesion and 15 days of transfection, L15T15. The scale bars = 20 μm are common for all the micrographs. ns = not significant. ***P < 0.001 when compared with the intact condition. £ = P < 0.001 when compared with L30. One-way ANOVA with Newman-Keuls post hoc test. n = 4 different rats for each condition. GFAP, glial fibrillary acidic protein; NG2, Neuron/Glial type 2.
Figure 9
Figure 9
Protein levels of inflammatory cytokines in the nigrostriatal system. Graphs showing the protein levels of TNF-α, IL-1β, and IL-6 using indirect ELISA in the substantia nigra (SN) (A) and in the striatum (B). ns = not significant, *P < 0.05, **P < 0.01, ***P < 0.001 when compared with the intact condition. ∂ = P < 0.05, † = P < 0.01, £ = P < 0.001 when compared with L30. One-way ANOVA with Newman-Keuls post hoc test. n = 4 different rats for each condition.

References

    1. Petrova P, Raibekas A, Pevsner J, Vigo N, Anafi M, Moore MK, Peaire AE, Shridhar V, Smith DI, Kelly J, Durocher Y, Commissiong JW. MANF: a new mesencephalic, astrocyte-derived neurotrophic factor with selectivity for dopaminergic neurons. J Mol Neurosci. 2003;20:173–188. doi: 10.1385/JMN:20:2:173. - DOI - PubMed
    1. Lindholm P, Voutilainen MH, Lauren J, Peranen J, Leppanen VM, Andressoo JO, Lindahl M, Janhunen S, Kalkkinen N, Timmusk T, Tuominen RK, Saarma M. Novel neurotrophic factor CDNF protects and rescues midbrain dopamine neurons in vivo. Nature. 2007;448:73–77. doi: 10.1038/nature05957. - DOI - PubMed
    1. Lindholm P, Peranen J, Andressoo JO, Kalkkinen N, Kokaia Z, Lindvall O, Timmusk T, Saarma M. MANF is widely expressed in mammalian tissues and differently regulated after ischemic and epileptic insults in rodent brain. Mol Cell Neurosci. 2008;39:356–371. doi: 10.1016/j.mcn.2008.07.016. - DOI - PubMed
    1. Airavaara M, Shen H, Kuo CC, Peranen J, Saarma M, Hoffer B, Wang Y. Mesencephalic astrocyte-derived neurotrophic factor reduces ischemic brain injury and promotes behavioral recovery in rats. J Comp Neurol. 2009;515:116–124. doi: 10.1002/cne.22039. - DOI - PMC - PubMed
    1. Voutilainen MH, Back S, Porsti E, Toppinen L, Lindgren L, Lindholm P, Peranen J, Saarma M, Tuominen RK. Mesencephalic astrocyte-derived neurotrophic factor is neurorestorative in rat model of Parkinson’s disease. J Neurosci. 2009;29:9651–9659. doi: 10.1523/JNEUROSCI.0833-09.2009. - DOI - PMC - PubMed

Publication types