Comparative Study
. 2014 Dec 16;15(1):364.
doi: 10.1186/s12859-014-0364-4.

Comparisons of computational methods for differential alternative splicing detection using RNA-seq in plant systems

Affiliations
Comparative Study

Comparisons of computational methods for differential alternative splicing detection using RNA-seq in plant systems

Ruolin Liu et al. BMC Bioinformatics. .

Abstract

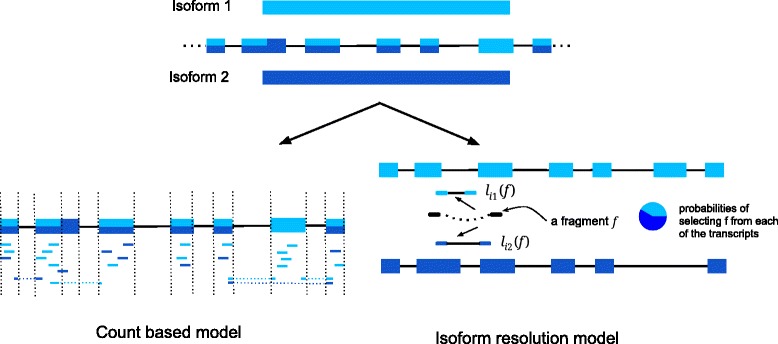
Background: Alternative Splicing (AS) as a post-transcription regulation mechanism is an important application of RNA-seq studies in eukaryotes. A number of software and computational methods have been developed for detecting AS. Most of the methods, however, are designed and tested on animal data, such as human and mouse. Plants genes differ from those of animals in many ways, e.g., the average intron size and preferred AS types. These differences may require different computational approaches and raise questions about their effectiveness on plant data. The goal of this paper is to benchmark existing computational differential splicing (or transcription) detection methods so that biologists can choose the most suitable tools to accomplish their goals.

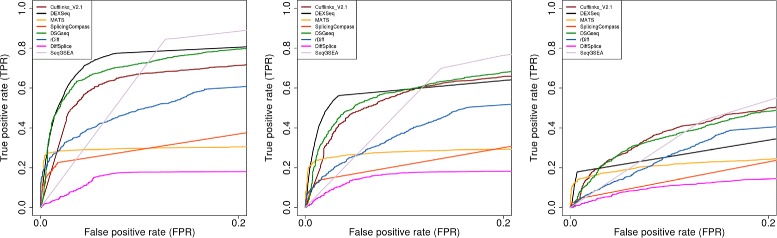
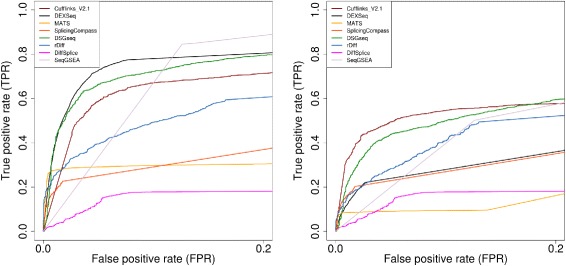
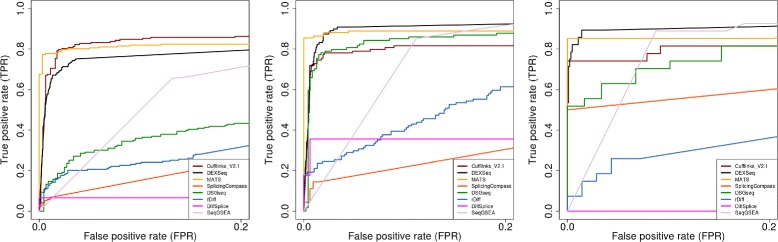
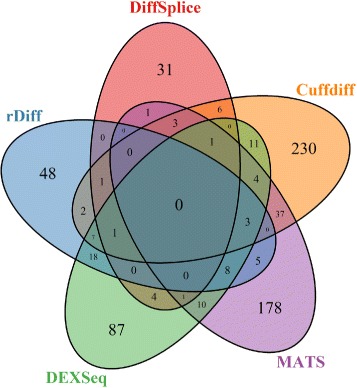
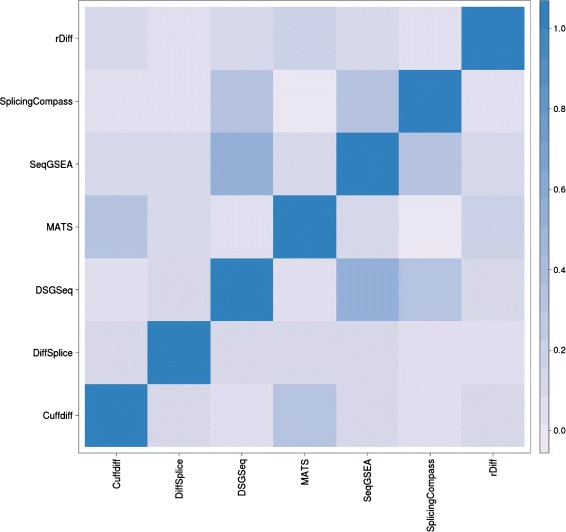
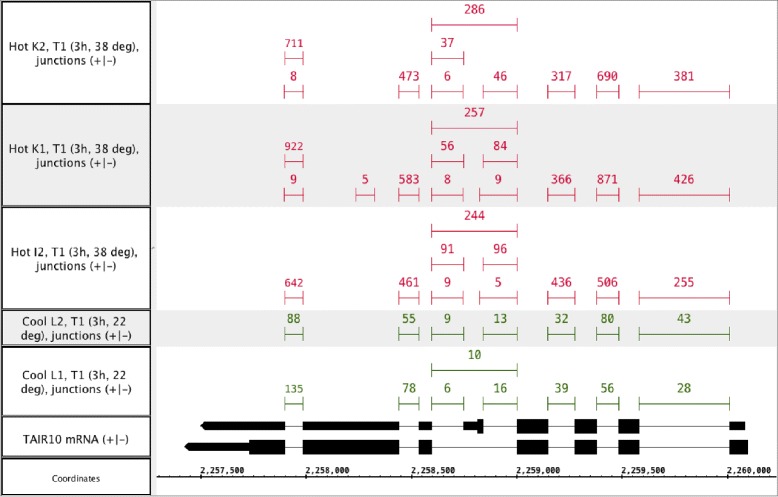
Results: This study compares the eight popular public available software packages for differential splicing analysis using both simulated and real Arabidopsis thaliana RNA-seq data. All software are freely available. The study examines the effect of varying AS ratio, read depth, dispersion pattern, AS types, sample sizes and the influence of annotation. Using a real data, the study looks at the consistences between the packages and verifies a subset of the detected AS events using PCR studies.

Conclusions: No single method performs the best in all situations. The accuracy of annotation has a major impact on which method should be chosen for AS analysis. DEXSeq performs well in the simulated data when the AS signal is relative strong and annotation is accurate. Cufflinks achieve a better tradeoff between precision and recall and turns out to be the best one when incomplete annotation is provided. Some methods perform inconsistently for different AS types. Complex AS events that combine several simple AS events impose problems for most methods, especially for MATS. MATS stands out in the analysis of real RNA-seq data when all the AS events being evaluated are simple AS events.


Figures

Figure 1
Figure 1
Quantification schema. A simplified gene model consists of two expressed isoforms (Top). Exons are colored according to the isoform of origin. Two model types used for quantification purpose (Bottom). In the count-based models (left), reads are assigned to counting units (shown by dash lines) without ambiguity. For each counting unit the model can be viewed as a test on two possible outcomes (spliced in or spliced out). The isoform resolution model is shown on the right where two ends of a read pair (show as dark solid boxes connected by curly dash line) align upstream and downstream of an alternative donor site. l i1(f) is the length of alignment of fragment f to isoform i1, and is shorter than l i2(f). Therefore if the fragment size distribution is known, it is possible to infer which isoform is more likely to generate f. Note that transcript effective length, i.e. l i1(f), l i2(f) and other parameters (depends on model you use) might also affect the probability of assigning reads to isoforms. Usually a maximum likelihood based approach is used to optimize this probability.
Figure 2
Figure 2
ROC curves evaluation for three levels of AS ratio when two groups of samples have the different dispersion pattern. ROC curves for eight selected methods in simulation studies High100xDiff (left panel), Medium100xDiff (middle panel), Low100xDiff (right panel). These ROC curves are obtained at a simple size of 3 for each condition. When the level or degree of DS across conditions become smaller (panel left-right), the power of discrimination of true-DS and non-DS drops significantly. However the relative ranking of each methods tend to be unchanged. DEXSeq perform consistently the best with respect to all three simulation studies.
Figure 3
Figure 3
ROC curves evaluation for accurate and incomplete annotation. ROC curves for eight selected methods using simulation study High100xDiff with complete annotation (left panel) and incomplete annotation (right panel). Isoform resolution model methods, such as Cufflinks, are more robust to incomplete annotation compared with count-based models methods.
Figure 4
Figure 4
ROC curves evaluations for three splicing classes. ROC curves of eight selected methods based on 1755 genes containing single splicing event from simulation study High100xDiff. These 1755 genes were further divided into three splicing event classes: 803 genes with alt. donor/acceptor sites (left panel), 850 genes with intron retention (middle panel), 102 genes with exon skipping (right panel).
Figure 5
Figure 5
Venn digram of heat shock data set. Overlap among the set of DS genes found by 5 methods. SplicingCompass is not included because it almost shares nothing with other methods based on Table 3.
Figure 6
Figure 6
Heat Map for correlation of the gene ranking scores obtained by the different methods for heat shock data set. The correlations are generally low for any two methods, indicating the methods are very different. Two methods both using NB statistics (DSGseq and SeqGSEA) achieve the highest Spearman rank correlation of 0.52.
Figure 7
Figure 7
SR45a. Heat-induced differential splicing of Arabidopsis gene SR45a (AT1G07350) encoding an RNA-binding protein involved in splicing. Tracks labeled Hot and Cool contain exon-exon junction features inferred from spliced read alignments from heat-treated (hot) and control samples (cool). Junctions with fewer than five supporting reads are not shown. Two annotated gene models for SR45a are shown in the track labeled TAIR 10 mRNA. Taller blocks indicate translated regions of the gene model. Note that inclusion of an internal exon introduces a premature stop codon that interrupts translation and the exon-skipped form likely encodes the full-length protein. The gene is on the minus strand of chr1 and so transcription proceeds from right to left.

References

    1. Black DL. Mechanisms of alternative pre-messenger RNA splicing. Annu Rev Biochem. 2003;72:291–336. doi: 10.1146/annurev.biochem.72.121801.161720. - DOI - PubMed
    1. Lareau LF, Green RE, Bhatnagar RS, Brenner SE. The evolving roles of alternative splicing. Curr Opin Struct Biol. 2004;14(3):273–282. doi: 10.1016/j.sbi.2004.05.002. - DOI - PubMed
    1. Syed NH, Kalyna M, Marquez Y, Barta A, Brown JW. Alternative splicing in plants–coming of age. Trends Plant Sci. 2012;17(10):616–623. doi: 10.1016/j.tplants.2012.06.001. - DOI - PMC - PubMed
    1. Keren H, Lev-Maor G, Ast G. Alternative splicing and evolution: diversification, exon definition and function. Nat Rev Genet. 2010;11(5):345–355. doi: 10.1038/nrg2776. - DOI - PubMed
    1. Graveley BR, Brooks AN, Carlson JW, Duff MO, Landolin JM, Yang L, Artieri CG, van Baren MJ, Boley N, Booth BW, Brown JB, Cherbas L, Davis CA, Dobin A, Li R, Lin W, Malone JH, Mattiuzzo NR, Miller D, Sturgill D, Tuch BB, Zaleski C, Zhang D, Blanchette M, Dudoit S, Eads B, Green RE, Hammonds A, Jiang L, Kapranov P, et al. The developmental transcriptome of Drosophila melanogaster. Nature. 2011;471(7339):473–479. doi: 10.1038/nature09715. - DOI - PMC - PubMed

Publication types

LinkOut - more resources