. 2015 Feb 20;290(8):4843-4855.
doi: 10.1074/jbc.M114.582700. Epub 2014 Dec 15.

Kinetic and structural characterization of the interaction between the FMN binding domain of cytochrome P450 reductase and cytochrome c

Affiliations

Kinetic and structural characterization of the interaction between the FMN binding domain of cytochrome P450 reductase and cytochrome c

Rui Huang et al. J Biol Chem. .

Abstract

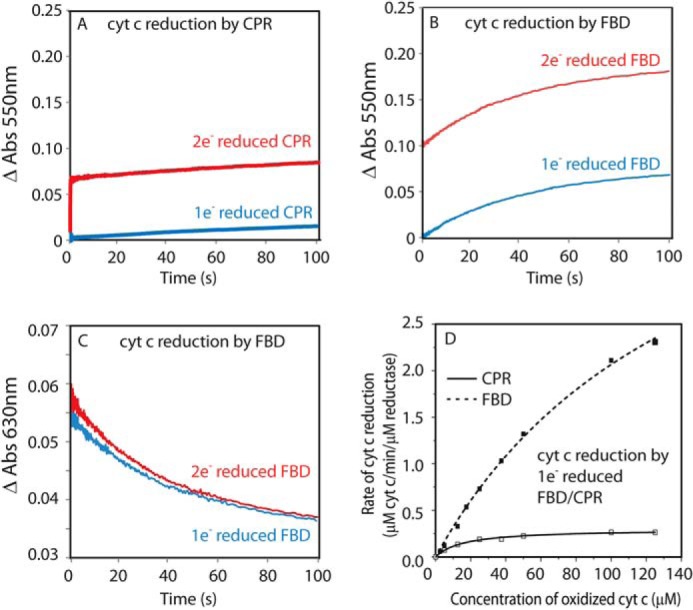
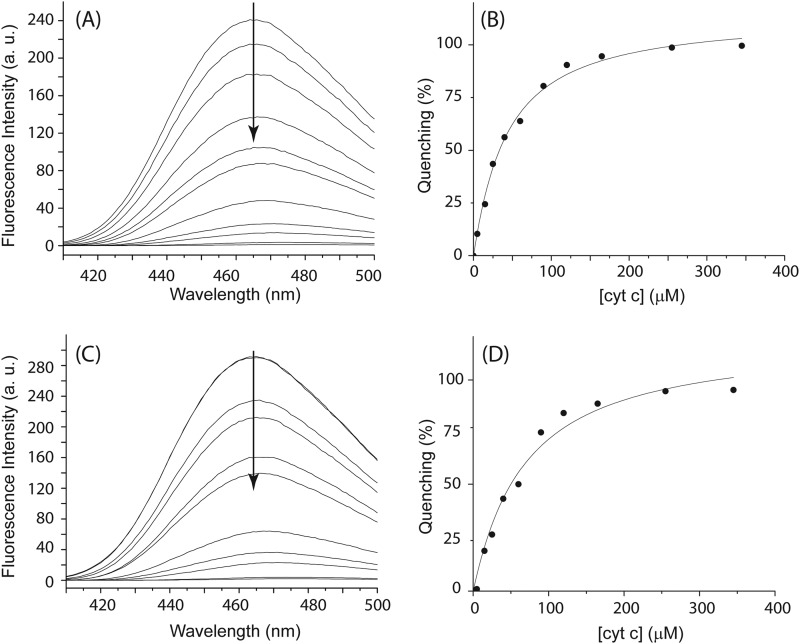
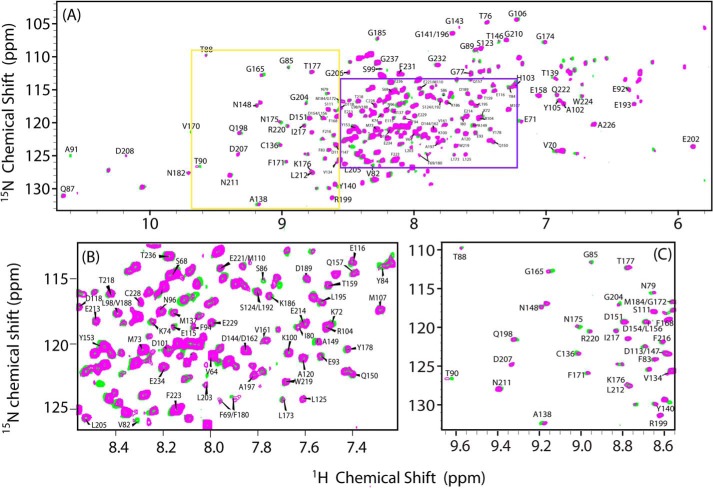
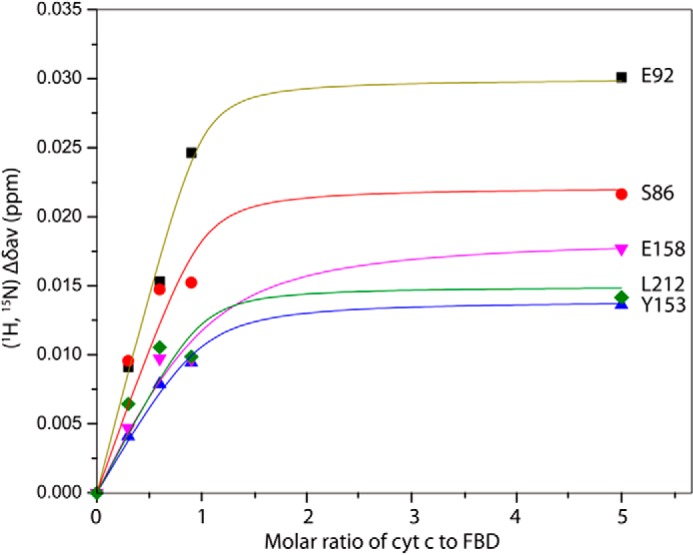
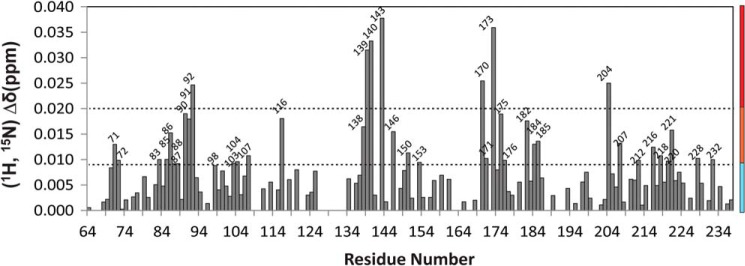
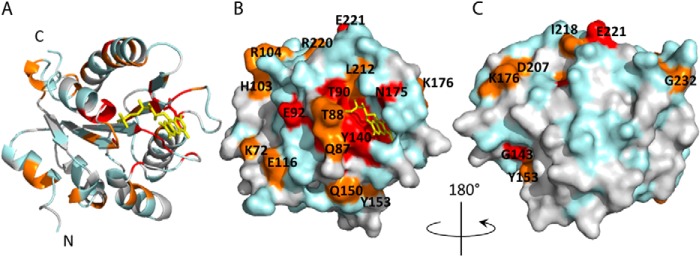
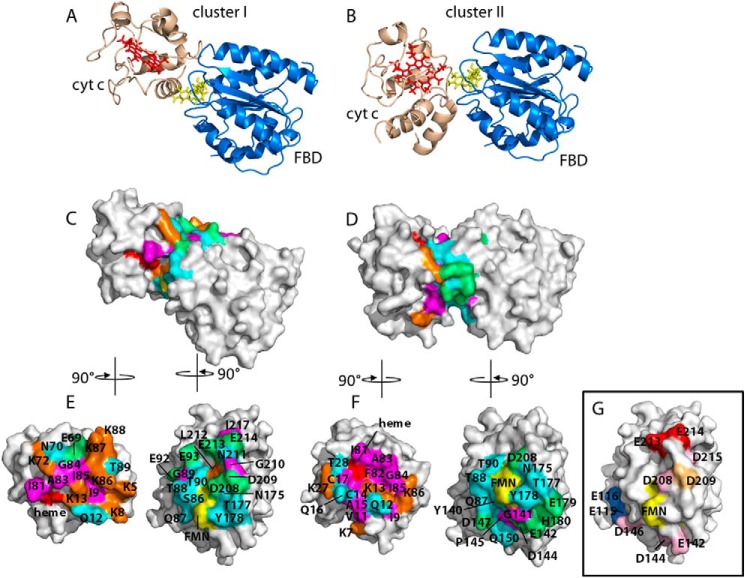
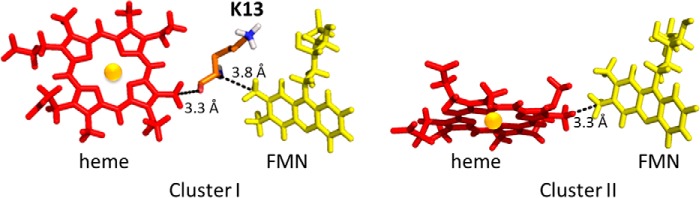
Cytochrome P450 reductase (CPR) is a diflavin enzyme that transfers electrons to many protein partners. Electron transfer from CPR to cyt c has been extensively used as a model reaction to assess the redox activity of CPR. CPR is composed of multiple domains, among which the FMN binding domain (FBD) is the direct electron donor to cyt c. Here, electron transfer and complex formation between FBD and cyt c are investigated. Electron transfer from FBD to cyt c occurs at distinct rates that are dependent on the redox states of FBD. When compared with full-length CPR, FBD reduces cyt c at a higher rate in both the semiquinone and hydroquinone states. The NMR titration experiments reveal the formation of dynamic complexes between FBD and cyt c on a fast exchange time scale. Chemical shift mapping identified residues of FBD involved in the binding interface with cyt c, most of which are located in proximity to the solvent-exposed edge of the FMN cofactor along with other residues distributed around the surface of FBD. The structural model of the FBD-cyt c complex indicates two possible orientations of complex formation. The major complex structure shows a salt bridge formation between Glu-213/Glu-214 of FBD and Lys-87 of cyt c, which may be essential for the formation of the complex, and a predicted electron transfer pathway mediated by Lys-13 of cyt c. The findings provide insights into the function of CPR and CPR-cyt c interaction on a structural basis.

Keywords: Cytochrome P450; Cytochrome c; Electron Transfer Complex; Enzyme Kinetics; Nuclear Magnetic Resonance (NMR); Protein Structure; Protein-Protein Interaction.


Figures

FIGURE 1.
FIGURE 1.
SDS-polyacrylamide gel, redox titration, and autoxidation of FBD. A, SDS-polyacrylamide gel of FBD. The single band reveals the purity of the protein. The unit of the molecular weight is kDa. B, spectral changes during a redox titration of FBD with sodium dithionite under anaerobic conditions. The titration was performed as described under “Experimental Procedures.” The isosbestic points at different titration stages are marked by black arrows. C, kinetic transients of autoxidation of two electron-reduced FBD. FBD was pre-reduced to the two electron-reduced state by stoichiometric titration with sodium dithionite. The reaction was initiated by rapid mixing of two electron-reduced FBD and the oxygen-saturated buffer, and it was monitored at 585 and 454 nm by UV-visible spectroscopy.
FIGURE 2.
FIGURE 2.
Electron transfer between FBD/full-length CPR and cyt c. FBD/CPR (11.3 μm) was reduced to one electron- and two electron-reduced states by stoichiometric titration with sodium dithionite and then rapidly mixed with cyt c in the stopped-flow spectrometer. A, reduction of cyt c (100 μm) by one electron-reduced (blue) and two electron-reduced (red) CPR was monitored at 550 nm. B and C, reduction of cyt c (100 μm) by one electron-reduced (blue) and two electron-reduced (red) FBD was monitored at 550 nm (B), and oxidation of semiquinone FMN was monitored at 630 nm (C). D, dependence of the initial rate of cyt c reduction by one electron-reduced FBD and CPR on varying concentrations of cyt c.
FIGURE 3.
FIGURE 3.
Two-step mechanism of electron transfer from two electron-reduced FBD to cyt c.
FIGURE 4.
FIGURE 4.
Cyt c reduction by pre-reduced full-length CPR and FBD. FBD/CPR (7 μm) was reduced to one electron-reduced state by dithionite and mixed with oxidized cyt c (14 μm) under anaerobic conditions. A, spectra of one electron-reduced CPR and cyt c were recorded before mixing (cyan) and 30 min after mixing (red). NADPH (20 μm) was added into the mixture anaerobically (dashed blue line) and resulted in total reduction of cyt c (arrow 1), whereas CPR remained in one electron-reduced state (arrow 2). B, spectra of one electron-reduced FBD and cyt c was recorded before mixing (cyan) and 30 min after mixing (red). The reduction of cyt c and oxidation of FMN semiquinone is indicated by arrows 1 and 2, respectively. The spectra before mixing were calculated by addition of the individual spectra of the two components.
FIGURE 5.
FIGURE 5.
Determination of Kd value between oxidized FBD/CPR and cyt c by fluorescence quenching. Fluorescence quenching of oxidized CPRCPM (A and B) and FBDCPM (C and D) titrated by cyt c was determined at the following cyt c concentrations: 0, 5, 15, 25, 40, 60, 90, 120, 165, 255, and 345 μm. The concentrations of CPRCPM and FBDCPM are 10 μm. The emission spectra were collected at room temperature with an excitation at 385 nm. Fluorescence quenching at 465 nm is plotted (B and D) and fitted with Equation 2. All titrations were carried out in 100 mm potassium phosphate buffer containing 5% (w/v) glycerol at pH 7.4.
FIGURE 6.
FIGURE 6.
Two-dimensional 1H/15N HSQC spectra of FBD in its free form and in complex with cyt c. A, superposition of 1H/15N HSQC spectra of 15N-labeled FBD in the free form (green) and in complex with unlabeled cyt c (magenta). The FBD/cyt c molar ratio was 1:5 in 100 mm potassium phosphate buffer at pH 7.4 containing 5% (w/v) glycerol. B and C, expansions of crowded regions of the spectra given in A.
FIGURE 7.
FIGURE 7.
Titration of 15N-labeled FBD with unlabeled cyt c. Changes in weighted average of chemical shifts (Δδave) for the backbone amides of Ser-86, Glu-92, Tyr-153, Glu-158, and Leu-212 of 15N-labeled FBD (0.3 mm) upon titration of unlabeled cyt c.
FIGURE 8.
FIGURE 8.
Chemical shift perturbation analysis. A histogram presenting the weighted average amide chemical shift of FBD upon complex formation with cyt c. The molar ratio of FBD to cyt c is 1:1. The chemical shift perturbation is categorized as high (red), medium (orange), and not significant (cyan), presented by the vertical color stripe, and is also mapped onto the structure of FBD in Fig. 9.
FIGURE 9.
FIGURE 9.
Chemical shift mapping of FBD upon complex formation with cyt c. A, schematic representation of FBD. Residues are colored according to the amplitudes of amide chemical shift changes upon binding cyt c, following the color codes in Fig. 8. Red, orange, and cyan represent residues with high, medium, and not significant chemical shift perturbations, respectively. Overlapped and unassigned residues are colored gray. B, surface representation of A. C, 180° rotation view of B.
FIGURE 10.
FIGURE 10.
Structural models of the FBD-cyt c complex. A and B, representatives of the two clusters of the lowest energy complex structures generated from HADDOCK. PDB 1AMO and PDB 1AKK were used as the initial structures of FBD and cyt c in the docking. Heme and the FMN cofactor are presented by red and yellow sticks, respectively. C and D, surface representations of the two complexes (A and B). Interfacial residues involved in protein-protein contacts in the complex models are highlighted and color-coded based on the properties of the amino acids. Polar neutral, nonpolar, positive, and negative residues are given as cyan, magenta, orange, and green, respectively. Heme and the cofactor FMN are colored red and yellow, respectively. E and F (from C and D), FBD and cyt c are rotated around their vertical axes by 90° as indicated, to display the binding interfaces. Residues are identified with the single-letter amino acid code. G, mapping of interfacial information on FBD from previous mutagenesis studies. Mutations of residues colored in red and pink lead to reduced activity and no effect on the activity of human FBD in cyt c reduction, respectively (14). Mutation of the residue colored in sand does not affect the cyt c reducing activity of rat CPR (17), and for the residues colored in blue, mutations improve the catalytic efficiency for cyt c reduction (13).
FIGURE 11.
FIGURE 11.
Electron transfer pathway predicted using HARLEM. Black dotted lines show the predicted electron transfer pathway for clusters I and II.

References

    1. Ortiz de Montellano P. R. (ed) (2005) Cytochrome P450: Structure, Mechanism, and Biochemistry, pp. 115–118, Kluwer Academic/Plenum Publishers, New York
    1. Schacter B. A., Nelson E. B., Marver H. S., Masters B. S. (1972) Immunochemical evidence for an association of heme oxygenase with the microsomal electron transport system. J. Biol. Chem. 247, 3601–3607 - PubMed
    1. Oshino N., Imai Y., Sato R. (1971) A function of cytochrome b5 in fatty acid desaturation by rat liver microsomes. J. Biochem. 69, 155–167 - PubMed
    1. Williams C. H., Jr., Kamin H. (1962) Microsomal triphosphopyridine nucleotide-cytochrome c reductase of liver. J. Biol. Chem. 237, 587–595 - PubMed
    1. Bachur N. R., Gordon S. L., Gee M. V., Kon H. (1979) NADPH cytochrome P-450 reductase activation of quinone anticancer agents to free radicals. Proc. Natl. Acad. Sci. U.S.A. 76, 954–957 - PMC - PubMed

Publication types

MeSH terms

LinkOut - more resources