. 2014 Dec 22;207(6):753-66.
doi: 10.1083/jcb.201406068. Epub 2014 Dec 15.

Thyroid hormone regulates muscle fiber type conversion via miR-133a1

Affiliations

Thyroid hormone regulates muscle fiber type conversion via miR-133a1

Duo Zhang et al. J Cell Biol. .

Abstract

It is known that thyroid hormone (TH) is a major determinant of muscle fiber composition, but the molecular mechanism by which it does so remains unclear. Here, we demonstrated that miR-133a1 is a direct target gene of TH in muscle. Intriguingly, miR-133a, which is enriched in fast-twitch muscle, regulates slow-to-fast muscle fiber type conversion by targeting TEA domain family member 1 (TEAD1), a key regulator of slow muscle gene expression. Inhibition of miR-133a in vivo abrogated TH action on muscle fiber type conversion. Moreover, TEAD1 overexpression antagonized the effect of miR-133a as well as TH on muscle fiber type switch. Additionally, we demonstrate that TH negatively regulates the transcription of myosin heavy chain I indirectly via miR-133a/TEAD1. Collectively, we propose that TH inhibits the slow muscle phenotype through a novel epigenetic mechanism involving repression of TEAD1 expression via targeting by miR-133a1. This identification of a TH-regulated microRNA therefore sheds new light on how TH achieves its diverse biological activities.


Figures

Figure 1.
Figure 1.
TH regulates miR-133a expression in skeletal muscle. (A) qRT-PCR analysis of miR-1, miR-206, miR-133a, miR-208b, and miR-499 in SOL muscle of MMI-treated mice injected with T3 for 4 h (n = 3). (B) qRT-PCR analysis of the time-course expression of miR-133a in SOL muscle of MMI-treated mice after T3 injection. Expression levels for miR-133a were normalized to U6 small nucleolar RNA (snRNA) expression (n = 3). (C) MMI-treated TRα1+/+TRβ+/+ mice and TRα1−/−TRβ−/− mice were injected with T3 for 2 h. Expression levels of miR-133a in SOL muscle were determined by qRT-PCR (n = 4). (D) Quantification of TRα1 and TRβ1 copy number in liver (LIV), GAS, and SOL by absolute quantification RT-PCR using a standard curve (n = 3). (E–G) qRT-PCR analysis of miR-133a in SOL muscle of TRα1−/− mice (E), TRβ−/− mice (F), and TRα1−/−TRβ−/− mice (G; n = 4). (H–J) qRT-PCR analysis of miR-133a in C2C12 cells under different culture conditions: C2C12 myotubes induced by Td differentiation medium for 3 d after T3 treatment (H), C2C12 myoblasts cultured in Td growth medium for 24 h before T3 treatment (I), and C2C12 myogenesis induced by Td differentiation medium or Td differentiation medium with T3 added (J). (K) SOL muscles isolated from mice were cultured in Td growth medium for 4 h before T3 treatment. The time-course expression of miR-133a in SOL muscles was analyzed with qRT-PCR (n = 3). (L) CHX pretreatment did not affect the regulation of miR-133a by T3 in C2C12 myoblasts. Means ± SD (error bars) are shown. *, P < 0.05; **, P < 0.01; ***, P < 0.001.
Figure 2.
Figure 2.
miR-133a1 is a direct target gene of TH. (A) The genomic location of mouse miR-1 and miR-133a. Evolutionarily conserved fragments are shown. (B–E) The activities of miR-1-2/miR-133a1 enhancer (B and D) or miR-1-1/miR-133a2 enhancer (C and E) in HEK293T cells or C2C12 myoblasts were measured with a luciferase assay. Cells were transfected with TRα1 and/or treated with T3 as indicated. (F) Schematic representation of the miR-1-2/miR-133a1 enhancer and truncated reporters. The sequence of TRE mutation is shown. (G–K) The activities of reporters containing truncated miR-1-2/miR-133a1 enhancer-F1 (G), -F2 (H), -F3 (I), -F4 (J), and -F2 with TRE mutation (K) were measured with a luciferase assay in HEK293T cells. (L–O) A ChIP assay was performed using chromatin from TRα1-transfected HEK293T cells (L) or C2C12 myotubes (M). Anti-RNA Polymerase II (Pol II), normal mouse IgG, anti-TR (C4), and anti-SRC-1 antibodies were used for immunoprecipitation. Purified DNA was then analyzed by PCR using control primers for human GAPDH promoter or the TRE region in miR-1-2/miR-133a1 enhancer. Water was used as a negative control for PCR (empty). Purified DNA was also analyzed by qPCR, and fold enrichment is expressed as the ratio of positive signal to IgG signal calculated by extrapolation from a standard curve of input DNA dilutions (N and O). Means ± SD (error bars) are shown. *, P < 0.05; **, P < 0.01.
Figure 3.
Figure 3.
miR-133a is abundant in fast twitch muscle and controls the muscle fiber type phenotype. (A and B) Metachromatic ATPase staining of GAS-M, SOL, and TA muscle from adult mice (A) and rats (B). (C–F) Percentage of type I (C and D) and type II (E and F) fibers in various muscles of mice (C and E) and rats (D and F) according to the ATPase staining are shown. (G and H) Expression of miR-133a in mouse (G) or rat (H) GAS-M, SOL, and TA muscle was determined by qRT-PCR (n = 3). (I–L) In vivo gene transfer into adult mice SOL muscle using plasmid MDH1-miR-133a (I) or miR-133a mimics (J), MDH1-miR-133a sponge (K), or miR-133a inhibitor (L) for 7 d as indicated. Expression levels of MHC isoforms and oxidative fiber markers were determined by qRT-PCR (n = 4). (M and N) C2C12 myoblasts were transfected with miR-133a mimics (M) or miR-133a inhibitor (N) as indicated. 24 h after transfection, C2C12 myogenesis was induced. qRT-PCR was performed to quantify the relative levels of MHC isoforms and oxidative fiber markers in C2C12 myotubes at day 3 of differentiation. (O–Q) C2C12 myoblasts were induced into myotubes by changing differentiation medium. 24 h after induction, C2C12 cells were transfected with miR-133a mimics or miR-133a inhibitor as indicated. Immunostaining of C2C12 myotubes was performed using antibody against MHC and myosin-fast (O) or myosin-slow (P) 48 h after transfection. MHC was stained for normalization. Representative images of cells were taken with a fluorescence microscope. Quantitative values were determined in four random fields for each group (Q). (R) Expression levels of miR-133a were determined 14 d after electroporation in rat SOL muscle by qRT-PCR (n = 3). (S) ATPase and hematoxylin and eosin (H&E) staining of rat SOL muscle 14 d after electroporation using plasmid MDH1-miR-133a. (T) Percentage of type I fibers in rat SOL muscle 14 d after electroporation according to the ATPase staining (n = 3). Means ± SD (error bars) are shown. *, P < 0.05; **, P < 0.01; ***, P < 0.001. Bars: (A and B) 150 µm; (O and P) 200 µm; (S) 150 µm.
Figure 4.
Figure 4.
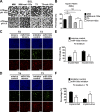
miR-133a is required for the TH action on myofiber type conversion. (A) ATPase staining of mouse SOL muscle from hypothyroid mice (MMI group), hypothyroid mice injected with ant-133a (MMI+ant-133a group), T3-treated hypothyroid mice (T3 group), and T3-treated hypothyroid mice injected with ant-133a (T3+ant-133a group). The treatment of T3 and/or ant-133a lasted for 14 d. (B) The percentage of type I fibers was quantified in SOL muscle of these mice. (C and D) C2C12 myotubes were transfected with miR-133a mimics, mimics control, miR-133a inhibitor, or inhibitor control in the absence or presence of T3. Immunostaining of C2C12 myotubes was performed using antibody against MHC and myosin-fast (C) or myosin-slow (D) 48 h after transfection. Representative results were shown. (E and F) Quantitative values were determined in four random fields for each group. Means ± SD (error bars) are shown. *, P < 0.05; **, P < 0.01; ***, P < 0.001. Bars: (A) 150 µm; (C and D) 200 µm.
Figure 5.
Figure 5.
TEAD1 is a direct target gene of miR-133a. (A) Position of miR-133a regulatory element in TEAD1 3′ UTR and sequence alignment of miR-133a and the TEAD1 3′ UTR from various species are shown. (B) Western blot analysis of TEAD1 in C2C12 and L6 myoblasts transfected with miR-133a mimics. (C and D) Western blot analysis of TEAD1 in C2C12 (C) and L6 (D) myotubes transfected with miR-133a mimics or inhibitor. C2C12 and L6 myoblasts were transfected with miR-133a mimics or inhibitor. 24 h after transfection, myoblasts were induced into myotubes for 3 d. (E) Luciferase reporter containing TEAD1 3′ UTR sequences was cotransfected into HEK293T cells with miR-133a mimics. 48 h after transfection, Renilla luciferase activity was measured and normalized to firefly luciferase activity. (F) Mutations (underlined) were introduced into TEAD1 3′ UTR to disrupt base-pairing with miR-133a seed sequence. MREs for miR-133a are shown in bold. (G) Luciferase reporter containing wild type and mutant TEAD1 3′ UTR was cotransfected into HEK293T cells with miR-133a mimics. 48 h after transfection, luciferase activity was measured and normalized to firefly luciferase activity. (H and I) TEAD1 expression was measured in GAS-M, SOL, and TA muscle from mice (H) and rats (I) by Western blot analysis. (J) Western blot analysis of TEAD1 was performed on protein lysates from SOL muscle of MMI-treated mice with or without T3 treatment for 2 h or 5 d. (K) Western blot analysis of TEAD1 in SOL muscle of MMI-treated TRα1−/−TRβ−/− mice with or without 5 d of T3 treatment. (L) Western blot analysis of TEAD1 in SOL muscle of TRα1−/−TRβ−/− mice. (M) Luciferase activity of the reporter containing the 3′ UTR of TEAD1 was analyzed in C2C12 cells in the presence or absence of T3. Means ± SD (error bars) are shown. *, P < 0.05; **, P < 0.01.
Figure 6.
Figure 6.
TEAD1 promotes fast-to-slow myofiber type conversion. (A and B) qRT-PCR analysis of the levels of MHC isoforms and oxidative fiber markers in SOL muscles (A) after TEAD1 plasmid electrotransfer and C2C12 myotubes (B) transfected with TEAD1 (n = 3). (C and D) qRT-PCR analysis of the levels of MHC isoforms and oxidative fiber markers in SOL muscle (C) after siTEAD1 electrotransfer and C2C12 myotubes (D) transfected with siTEAD1 (n = 3). (E and F) Immunofluorescent staining of C2C12 myotubes transfected with TEAD1 or siTEAD1 using antibodies against MHC and myosin-fast (E) or -slow (F). Bars, 200 µm. (G) Quantitative values were determined in four random fields for each group. Means ± SD (error bars) are shown. *, P < 0.05; **, P < 0.01; ***, P < 0.001.
Figure 7.
Figure 7.
TEAD1 mediates miR-133a and TH action in myofiber specification. (A and B) C2C12 myotubes were cotransfected with miR-133a mimics and/or TEAD1 with or without 3′ UTR. 48 h after transfection, immunostaining was performed. Bars, 200 µm. (C) Quantitative values were determined in four random fields for each group. (D) qRT-PCR analysis of the expression of TEAD1 and MyHC isoforms in C2C12 myotubes transfected with TEAD1 in the presence of T3. (E) qRT-PCR analysis of the expression of TEAD1 and MyHC isoforms in SOL muscles of MMI-treated mice, MMI-treated mice with T3 treatment for 5 d, and MMI-treated mice with electrotransfer of TEAD1 and T3 treatment for 5 d (n = 3). (F) Schematic representation of miR-133a–mediated TH function in muscle fiber type determination. Means ± SD (error bars) are shown. *, P < 0.05; **, P < 0.01.
Figure 8.
Figure 8.
The effect of T3, TEAD1, miR-133a on the promoter activity of MyHC-1. (A) Mouse MyHC-I gene promoter containing an MCAT element and putative TREs. (B) C2C12 myoblasts cultured in Td medium transfected with pGL3-Basic or a reporter containing TRE region. 24 h after transfection, T3 was added for 1 d. Promoter activities were evaluated with a luciferase assay. (C) C2C12 myoblasts were cotransfected with a reporter containing MyHC-I promoter and TEAD1 expression vector. Promoter activities were determined with a luciferase assay. (D) A ChIP assay was performed using chromatin from C2C12 myotubes. Anti-TEAD1, normal mouse IgG, and anti-TR (C4) antibodies were used for immunoprecipitation. Purified DNA was then analyzed by PCR using two sets of primers specific for the MCAT region. Water was used as a negative control for PCR (empty). (E) C2C12 myoblasts were cotransfected with miR-133a mimics or mimics control, and reporters containing MyHC-I promoter, MCAT element, or TRE region as indicated. Promoter activities were examined with a luciferase assay. Means ± SD (error bars) are shown. **, P < 0.01.

References

    1. Baldwin K.M., and Haddad F.. 2001. Effects of different activity and inactivity paradigms on myosin heavy chain gene expression in striated muscle. J. Appl. Physiol. 90:345–357. - PubMed
    1. Bassel-Duby R., and Olson E.N.. 2006. Signaling pathways in skeletal muscle remodeling. Annu. Rev. Biochem. 75:19–37 10.1146/annurev.biochem.75.103004.142622 - DOI - PubMed
    1. Brent G.A.2012. Mechanisms of thyroid hormone action. J. Clin. Invest. 122:3035–3043 10.1172/JCI60047 - DOI - PMC - PubMed
    1. Butler-Browne G.S., Herlicoviez D., and Whalen R.G.. 1984. Effects of hypothyroidism on myosin isozyme transitions in developing rat muscle. FEBS Lett. 166:71–75 10.1016/0014-5793(84)80047-2 - DOI - PubMed
    1. Caiozzo V.J., and Haddad F.. 1996. Thyroid hormone: modulation of muscle structure, function, and adaptive responses to mechanical loading. Exerc. Sport Sci. Rev. 24:321–361 10.1249/00003677-199600240-00013 - DOI - PubMed

Publication types

MeSH terms

LinkOut - more resources