. 2014 Dec 30;111(52):E5661-9.
doi: 10.1073/pnas.1416991111. Epub 2014 Dec 15.

Prehistoric genomes reveal the genetic foundation and cost of horse domestication

Affiliations

Prehistoric genomes reveal the genetic foundation and cost of horse domestication

Mikkel Schubert et al. Proc Natl Acad Sci U S A. .

Abstract

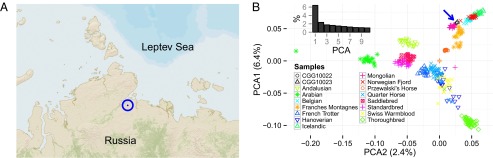
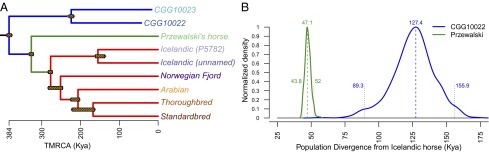
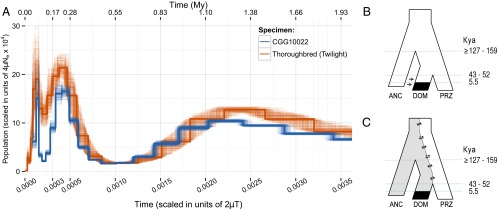
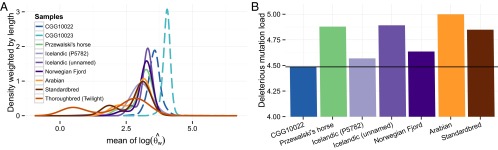
The domestication of the horse ∼ 5.5 kya and the emergence of mounted riding, chariotry, and cavalry dramatically transformed human civilization. However, the genetics underlying horse domestication are difficult to reconstruct, given the near extinction of wild horses. We therefore sequenced two ancient horse genomes from Taymyr, Russia (at 7.4- and 24.3-fold coverage), both predating the earliest archeological evidence of domestication. We compared these genomes with genomes of domesticated horses and the wild Przewalski's horse and found genetic structure within Eurasia in the Late Pleistocene, with the ancient population contributing significantly to the genetic variation of domesticated breeds. We furthermore identified a conservative set of 125 potential domestication targets using four complementary scans for genes that have undergone positive selection. One group of genes is involved in muscular and limb development, articular junctions, and the cardiac system, and may represent physiological adaptations to human utilization. A second group consists of genes with cognitive functions, including social behavior, learning capabilities, fear response, and agreeableness, which may have been key for taming horses. We also found that domestication is associated with inbreeding and an excess of deleterious mutations. This genetic load is in line with the "cost of domestication" hypothesis also reported for rice, tomatoes, and dogs, and it is generally attributed to the relaxation of purifying selection resulting from the strong demographic bottlenecks accompanying domestication. Our work demonstrates the power of ancient genomes to reconstruct the complex genetic changes that transformed wild animals into their domesticated forms, and the population context in which this process took place.

Keywords: Przewalski’s horse; ancient DNA; cost of domestication; horse domestication; positive selection.


Conflict of interest statement

The authors declare no conflict of interest.

Figures

Fig. 1.
Fig. 1.
Sampling location and PCA. (A) Geographic origin of ancient horse remains (73.046° N, 109.708° E). (B) Analysis is based on array data for ∼54,000 SNPs. The blue arrow indicates the position of CGG10022 and CGG10023. The smaller bar plot indicates the relative variance contribution of the 10 first principal components.
Fig. 2.
Fig. 2.
Horse phylogenetic relationships and population split times. (A) Maximum likelihood chronogram for horses based on whole-exome sequences and rooted using the domestic donkey as an outgroup. Most nodes received 100% bootstrap support, except for the Thoroughbred-Standardbred and Norwegian Fjord-Arabian-Thoroughbred-Standardbred clades, which showed 67% and 70% support, respectively. Maximum likelihood estimates for the TMRCA of each clade (x axis with the unit of kya), providing upper boundaries for population split times, were obtained using r8s. Yellow hatched bars indicate the 95% confidence interval derived from the dating of 100 bootstrap pseudoreplicates. (B) Lower boundaries for population split times. The posterior distributions shown correspond to analyses restricting mutations to transversions and considering CGG10022 and Przewalski’s horse, comparing these genomes with that of the Icelandic (unnamed) horse. The dashed and dotted lines indicate the mode and the 95% credibility interval, respectively. Additional analyses performed with other combinations of sequence data provided similar estimates (SI Appendix, section S2.8.2).
Fig. 3.
Fig. 3.
PSMC demographic inference and population models. (A) Demographic profile of the horse lineage over the past 2 My as inferred from bootstrapped PSMC analyses. (B) Population model assuming admixture between the descending population of ancient horses and the population that gave rise to domesticated horses [split times in kya (Kyr)]. ANC, ancient horse population; DOM, population of domesticated horses; PRZ, Przewalski’s horse population. (C) Alternative population model assuming the presence of ancestral population structure in these populations. Lower boundaries for population split times are derived from approximate Bayesian computation and display the full range of modes observed across the analyses performed (SI Appendix, Table S20).
Fig. 4.
Fig. 4.
Inbreeding and genetic load of predomesticated vs. modern breeds. (A) Genome-wide distribution of heterozygosity estimates for genomic tracks, calculated as the logarithm of the Watterson estimators, averaged across the track and weighted by its length. Transitions were excluded when calculating the Watterson estimators. Genomics tracks are defined as continuous regions of similar Watterson estimator values. The bimodal distributions observed for the modern horses, but not for CGG10022 and CGG10023, are indicative of inbreeding in these individuals. Dashed lines indicate ancient individuals. (B) Additive deleterious mutation load estimated from coding sequences of modern breeds and the high-coverage predomesticated sample (CGG10022), excluding the Thoroughbred Twilight and CGG10023.
Fig. 5.
Fig. 5.
Scans for positive selection. (A) Detection of selection by an increased and nonneutral ω-ratio, which represents the rate of nonsynonymous over synonymous mutations in the clade containing the domesticated horses (red). Examples include the SYNJ2, SLC43A1, and ALDH1L2 genes. (B) Detection of selection by a deficit in the observed rate of derived alleles in CGG10022 (blue) vs. the expected rate of derived alleles (red) among 32 modern breeds (represented here by the Belgian horse); the position of MC1R within the region under selection, indicated in yellow, is signified by a black dot. (C) Detection of selection defined by regions associated with decreased genetic diversity in domesticated horses relative to predomesticated horses [indicated by an increased log-ratio of the Watterson estimator (θw)] and showing potential deviation from neutrality (indicated by decreased Tajima’s D values). Such a simultaneous decrease in genetic diversity and deviation from neutrality is exemplified by the region overlapping the MC1R gene. (D) Detection of selection defined by a hidden Markov model that identifies long genomic tracks with a high probability (≥0.80) of carrying advantageous mutations cosegregating within the six modern breeds.

References

    1. Kelekna P. The Horse in Human History. Cambridge Univ Press; Cambridge, England: 2009.
    1. Outram AK, et al. The earliest horse harnessing and milking. Science. 2009;323(5919):1332–1335. - PubMed
    1. Wade CM, et al. Broad Institute Genome Sequencing Platform; Broad Institute Whole Genome Assembly Team Genome sequence, comparative analysis, and population genetics of the domestic horse. Science. 2009;326(5954):865–867. - PMC - PubMed
    1. Cruz F, Vilà C, Webster MT. The legacy of domestication: Accumulation of deleterious mutations in the dog genome. Mol Biol Evol. 2008;25(11):2331–2336. - PubMed
    1. Groenen MA, et al. Analyses of pig genomes provide insight into porcine demography and evolution. Nature. 2012;491(7424):393–398. - PMC - PubMed

Publication types