Review
. 2015 Jan;145(1):5-16.
doi: 10.1085/jgp.201411242. Epub 2014 Dec 15.

Structural model of the open-closed-inactivated cycle of prokaryotic voltage-gated sodium channels

Affiliations
Review

Structural model of the open-closed-inactivated cycle of prokaryotic voltage-gated sodium channels

Claire Bagnéris et al. J Gen Physiol. 2015 Jan.

Abstract

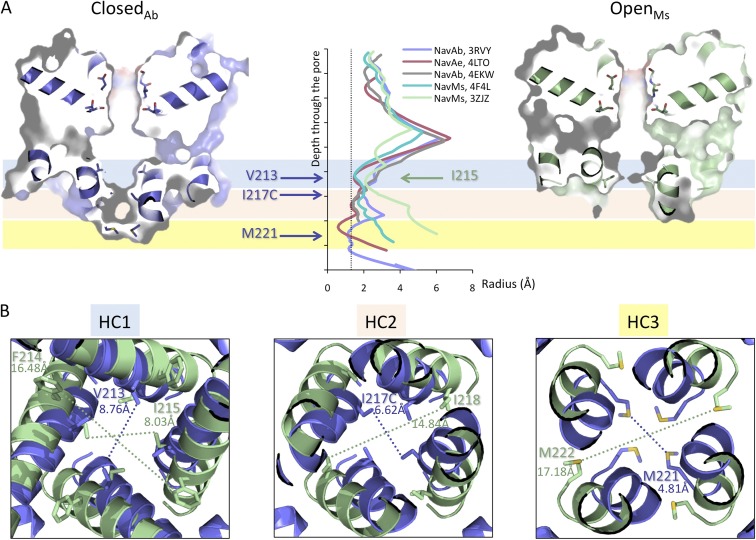
In excitable cells, the initiation of the action potential results from the opening of voltage-gated sodium channels. These channels undergo a series of conformational changes between open, closed, and inactivated states. Many models have been proposed for the structural transitions that result in these different functional states. Here, we compare the crystal structures of prokaryotic sodium channels captured in the different conformational forms and use them as the basis for examining molecular models for the activation, slow inactivation, and recovery processes. We compare structural similarities and differences in the pore domains, specifically in the transmembrane helices, the constrictions within the pore cavity, the activation gate at the cytoplasmic end of the last transmembrane helix, the C-terminal domain, and the selectivity filter. We discuss the observed differences in the context of previous models for opening, closing, and inactivation, and present a new structure-based model for the functional transitions. Our proposed prokaryotic channel activation mechanism is then compared with the activation transition in eukaryotic sodium channels.


Figures

Figure 1.
Figure 1.
Sequence alignment, using Clustal Omega (Sievers et al., 2011), of the prokaryotic sodium channel orthologues: NavMs from Magnetococcus marinus MC-1 (UniProt accession no. A0L5S6), NavAb from Arcobacter butzleri RM4018 (UniProt accession no. A8EVM5), NavAe from Alkalilimnicola ehrlichii MLHE-1 (UniProt accession no. Q0ABW0), NavCt from Caldalkalibacillus thermarum TA2.A1 (UniProt accession no. F5L478), NavRh from Rickettsiales sp. HIMB114 (UniProt accession no. D0RMU8), and domain IV (DIV) of the human Nav1.4 sodium channel (UniProt accession no. P35499). The identities of the helical regions (transmembrane helices S1–S6), the N-terminal intracellular helix S1N, the S4–S5 linker helix, the P1 and P2 pore helices, and the intracellular C-terminal coiled-coil (CC) helix are indicated in the horizontal colored tubes above the sequences and are based on the crystal structures of NavAb for the VS region (cyan), on the crystal structure of NavMs for the pore region (green), and on the site-directed electron paramagnetic resonance spectroscopy of NavMs and circular dichroism truncation studies of NaChBac for the CTD (gray). The vertical magenta bar indicates the extracellular negatively charged (ENC) region formed by D49 (in S2), and the red bars are the intracellular negatively charged (INC) region formed by E59 (in S2) and D81 (in S3) involved in the gating charge transfer across the membrane through sequential interactions with four arginine residues in S4 (indicated by the cyan vertical bars); in the “up” conformation, which corresponds to the activated state, residues E59 and D81 form the salt-bridged pairs. The residues comprising the SF are highlighted in light green vertical bars. The residues in purple are proposed to be the start of the twist in S6 that is implicated in activation gate opening (light purple from the partially open structure and dark purple in the fully open structure). The residue in yellow indicates the location of the final hydrophobic constriction region (HC3) in the closed structure, which effectively corresponds to the location of the activation gate.
Figure 2.
Figure 2.
Accessible surface differences between the open and closed structures. (A; middle) Accessible surface plots (made using CAVER software; Chovancova et al., 2012) showing radius versus distance through the central axis of the pore for ClosedAb-I217C (slate blue), ClosedAe (red), InactivatedAb (gray), OpenMs (light green), and pOpenMs (turquoise). (Left and right) Slab surface mode/cartoon depictions of the pores, sliced along the transmembrane direction for the ClosedAb (left, slate blue) and OpenMs (right, light green) pores, highlighting the sites of the first minor constriction (blue underlay: present for both forms with the responsible residues, V213 in the closed form and I215 in the open form), the second minor construction (orange underlay: present only in the closed form, residue I217C), and the third major constriction (yellow underlay: present only for the closed form, residue M221) at the intracellular end of the cavity. I217C is the mutation in the closed structure that enabled crystallization at higher resolution. (B) Detailed view of the three “hydrophobic constriction” (HC) regions noted above shown in cartoon and stick mode for the ClosedAb (slated blue) and OpenMs (light green) structures. The distances shown were measured between two diagonally opposite residues. It is clear that the narrow constrictions at HC2 and HC3 (6.62 and 4.81 Å) seen in the closed structure are not present in the open structure (where the equivalent distances are 14.84 and 17.18 Å).
Figure 3.
Figure 3.
Differences between the open and closed structures. (A) Comparison of the OpenMs (green) pore and the ClosedAb (slate blue) crystal structures, depicted in cylindrical mode viewed from the intracellular surface. The equivalent residue numbers for the pore domain were G129 to M221 in NavMs and G130 to M222 in NavAb. Three-dimensional alignments (in all cases the least-squares superpositions were done using residues 145–198 [or their sequence equivalents] at the top of helices S5 and S6) and figures were made using PyMOL software (Schrödinger, LLC). The motions associated with the S5 and S6 helices are indicated by the small and large arrows, respectively. One of the ClosedAb monomers is shown in gray, so that it can be seen that the region of the S4–S5 linker that the S5 helix in the open state would impinge on (magenta circle) is in the adjacent, not the same, monomer. (B) The Cα carbons of the S6 helixes (in stick motif) showing that the ClosedAb (slate blue), InactivatedAb (gray), and ClosedAe (red) structures overlay closely, but that the OpenMs (green) deviates from the other structures starting at residue T206. (C) Plot of the delta phi (blue) and delta psi (red) angles in the S6 helix as a function of residue number. Values are those of OpenMs structure (PDB accession no. 3ZJZ-A chain) minus those of the ClosedAb structure (3RVY-A chain), demonstrating that the differences start after residue T206 in NavMs and continue to the end of the S6 helix. The single peak at around residue 155 is not related to the transition but simply arises from different interactions of the two proteins, with the different crystallization detergent molecules present adjacent to this site. (D) Secondary structure alignments compared using the 2Struc server (Klose et al., 2010). The position corresponding to the T206 residue in helix S6 is indicated by the black box in both parts. (Top) OpenMs versus ClosedAb. The locations of the S5 and S6 helices are indicated by the horizontal green bars. Both structures have essentially identical secondary structures, even around T206. (Bottom) OpenMs versus InactivatedAb. The biggest differences are at the top of S5 (purple box) and in the turret loop (cyan box), not in helix S6 nor the region around T206.
Figure 4.
Figure 4.
Comparisons of the SF regions. (Left and middle columns) Views from the extracellular surface showing the size of the SF central holes, defined as the white areas in the middle of each structure. (Right column) Side view superpositions of the SFs in cartoon and stick depictions, in each case comparing the OpenMs structure (light green) with the corresponding structure in that row. The identities of the SF residues (TLES) are indicated. Only two monomers are shown for clarity. (A; left) OpenMs (pale green) and (middle) pOpenMs (turquoise) structures. (B; middle) ClosedAb (slate) and overlay (right) comparison of ClosedAb and OpenMs. (C) As in B for InactivatedAb (AB tetramer; gray). (D) As in B for InactivatedAb (CD tetramer; gray). (E) As in B for ClosedAe (raspberry). The distances between the narrowest parts of the SFs in each case are given in Table S1.
Figure 5.
Figure 5.
Schematic diagram of (1) closed, (2) open, and (3) inactivated states of prokaryotic sodium channels based on crystallographic studies. Only two monomers are shown in each figure for clarity. The color scheme is as in Fig. 1. The VS S1–S4 helices are depicted as cyan bars, the S4–S5 linker is an orange bar, the S5–S6 helices of the pore region are green bars, and the coiled-coil region of the CTD is gray. The extracellular negatively charged region in S2 is in a magenta circle, and the intracellular negatively charged regions in S2 and S3 are in red circles. The four arginines in S4 involved in the gating charge transfer across the membrane through sequential interactions, with the extracellular negatively charged region and the intracellular negatively charged region represented by a “+.” The residues forming the SF are indicated by red boxes. The residue in purple is the start of the S6 twist that results in the open gate; the residue in yellow is the third hydrophobic constriction site in the closed form, which is not constricted in the open form, and indicates the position of the activation gate. The white bars represent the helical region present in the CTD in the closed and inactivated structures, and the corresponding dotted gray lines are the disordered CTD linker region in the open conformation.

References

    1. Ahern C.A.2013. What activates inactivation? J. Gen. Physiol. 142:97–100 10.1085/jgp.201311046 - DOI - PMC - PubMed
    1. Armstrong C.M.2007. Life among the axons. Annu. Rev. Physiol. 69:1–18 10.1146/annurev.physiol.69.120205.124448 - DOI - PubMed
    1. Armstrong C.M., and Bezanilla F.. 1973. Currents related to movement of the gating particles of the sodium channels. Nature. 242:459–461 10.1038/242459a0 - DOI - PubMed
    1. Bagnéris C., DeCaen P.G., Hall B.A., Naylor C.E., Clapham D.E., Kay C.W.M., and Wallace B.A.. 2013. Role of the C-terminal domain in the structure and function of tetrameric sodium channels. Nat. Commun. 4:2465 10.1038/ncomms3465 - DOI - PMC - PubMed
    1. Bagnéris C., DeCaen P.G., Naylor C.E., Pryde D.C., Nobeli I., Clapham D.E., and Wallace B.A.. 2014. Prokaryotic NavMs channel as a structural and functional model for eukaryotic sodium channel antagonism. Proc. Natl. Acad. Sci. USA. 111:8428–8433 10.1073/pnas.1406855111 - DOI - PMC - PubMed

Publication types

MeSH terms

Substances