. 2015 Feb;35(4):758-68.
doi: 10.1128/MCB.01040-14. Epub 2014 Dec 15.

A posttranscriptional mechanism that controls Ptbp1 abundance in the Xenopus epidermis

Affiliations

A posttranscriptional mechanism that controls Ptbp1 abundance in the Xenopus epidermis

Agnès Méreau et al. Mol Cell Biol. 2015 Feb.

Abstract

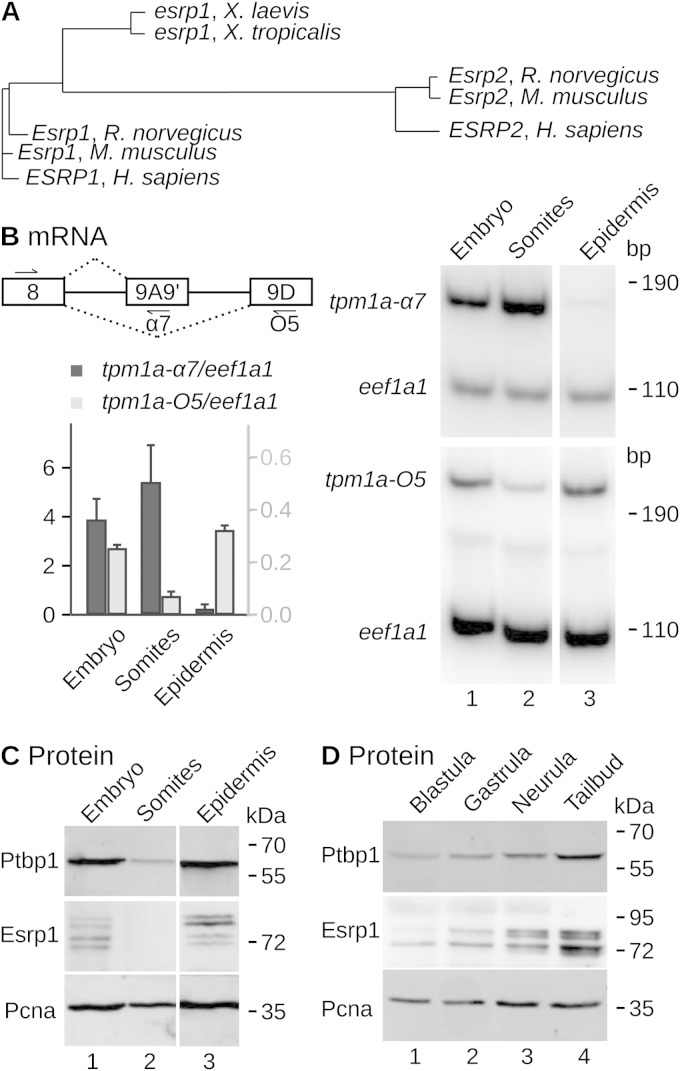
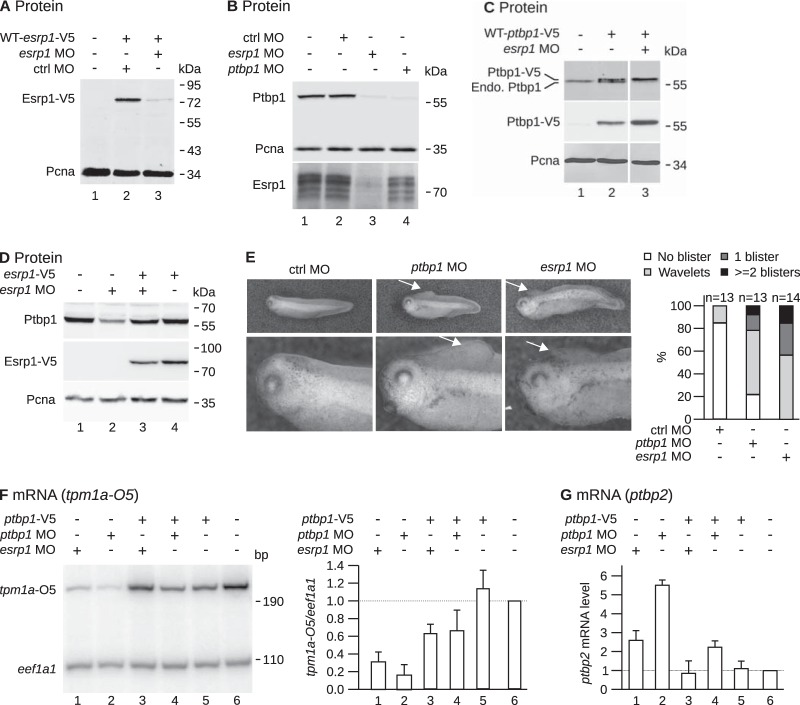
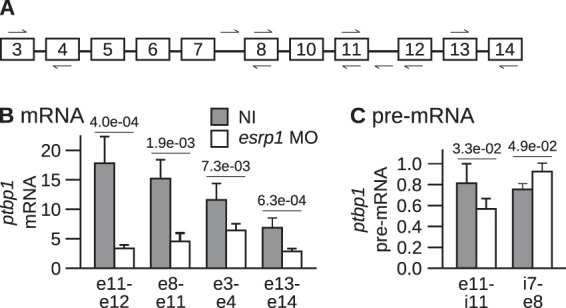
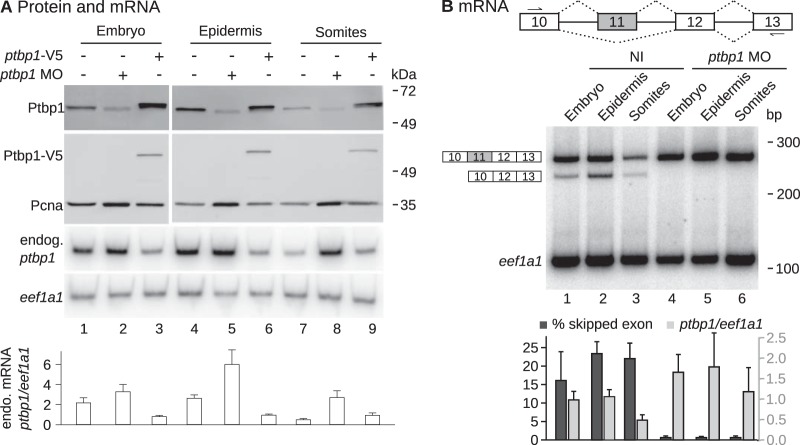
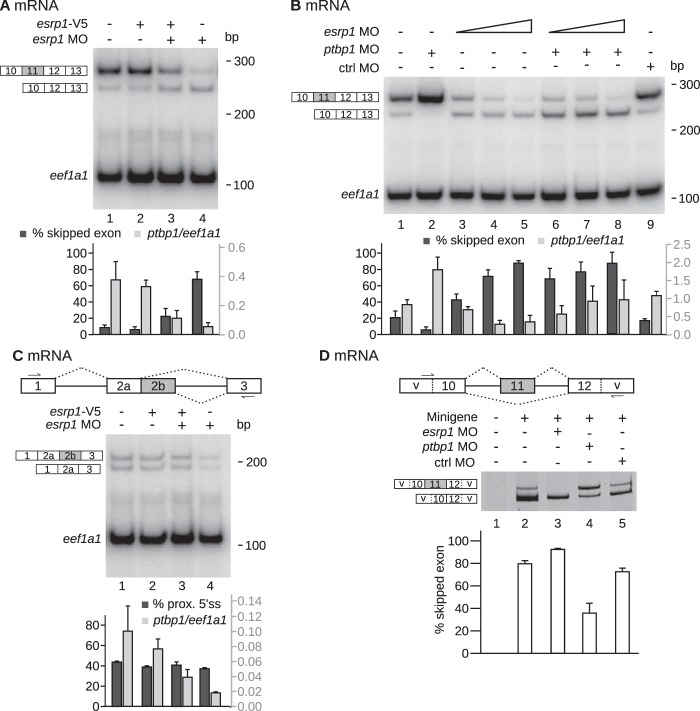
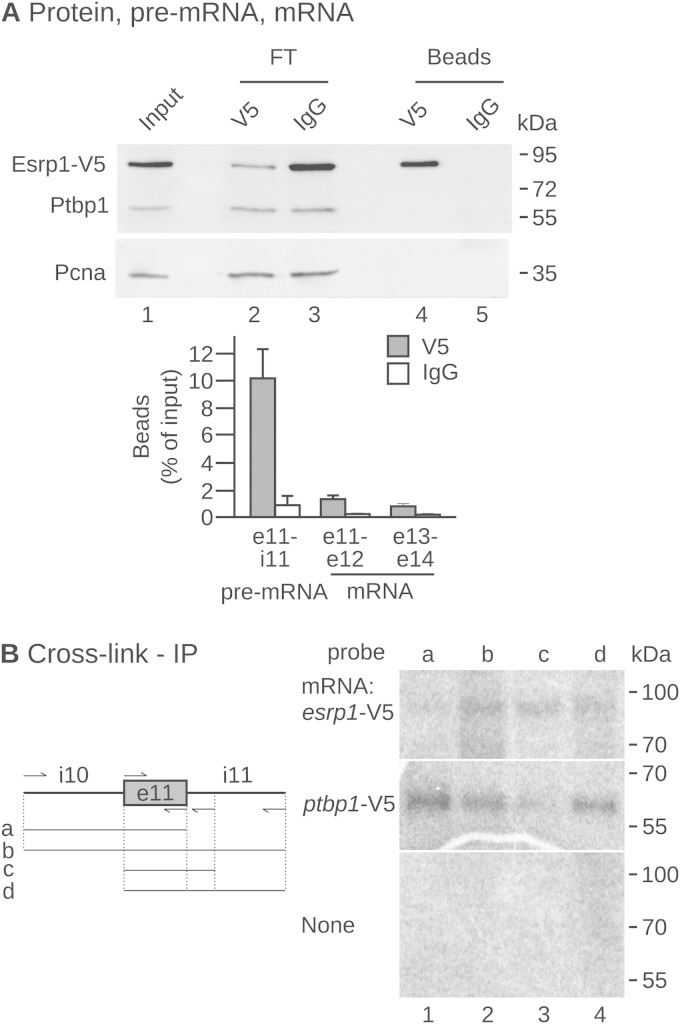
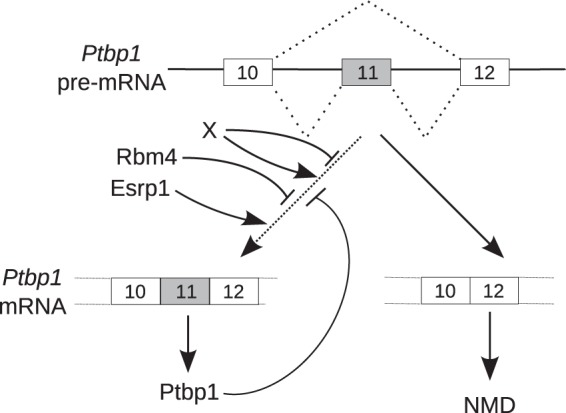
The output of alternative splicing depends on the cooperative or antagonistic activities of several RNA-binding proteins (RBPs), like Ptbp1 and Esrp1 in Xenopus. Fine-tuning of the RBP abundance is therefore of prime importance to achieve tissue- or cell-specific splicing patterns. Here, we addressed the mechanisms leading to the high expression of the ptbp1 gene, which encodes Ptbp1, in Xenopus epidermis. Two splice isoforms of ptbp1 mRNA differ by the presence of an alternative exon 11, and only the isoform including exon 11 can be translated to a full-length protein. In vivo minigene assays revealed that the nonproductive isoform was predominantly produced. Knockdown experiments demonstrated that Esrp1, which is specific to the epidermis, strongly stimulated the expression of ptbp1 by favoring the productive isoform. Consequently, knocking down esrp1 phenocopied ptbp1 inactivation. Conversely, Ptbp1 repressed the expression of its own gene by favoring the nonproductive isoform. Hence, a complex posttranscriptional mechanism controls Ptbp1 abundance in Xenopus epidermis: skipping of exon 11 is the default splicing pattern, but Esrp1 stimulates ptbp1 expression by favoring the inclusion of exon 11 up to a level that is limited by Ptbp1 itself. These results decipher a posttranscriptional mechanism that achieves various abundances of the ubiquitous RBP Ptbp1 in different tissues.


Figures

FIG 1
FIG 1
Coexpression of ptbp1 and esrp1 in Xenopus embryos. (A) Phylogenetic tree showing the distances between Xenopus esrp1 (Xenopus laevis and Xenopus tropicalis), human (Homo sapiens) ESRP1 and ESRP2, and rodent (Rattus norvegicus and Mus musculus) Esrp1 and Esrp2. (B) (Top left) Schematic drawing of tpm1a pre-mRNA. Constitutive exon 8 is spliced either to terminal exon 9A9′ to produce the α7 isoform or to terminal exon 9D to produce the O5 isoform. An additional exon, 9B, was omitted for clarity. The arrows reveal the positions of the PCR primers. (Right) The somites and the epidermis were dissected from stage 30 Xenopus embryos. The relative abundances of the indicated isoforms of the tpm1a mRNAs and of the eef1a1 mRNA (EF1α, as a loading control) were estimated in the two fractions and total nondissected sibling embryos by radioactive semiquantitative RT-PCR. (Lower left) Quantification from 3 similar experiments (mean ± SD). (C and D) The relative abundances of Ptbp1, Esrp1, and Pcna (as a loading control) in dissected embryos (C) or in total embryos arrested at different stages of development (D) were measured by Western blotting. The blastula is stages 6 to 8, the gastrula is stages 9 to 11, the neurula is stage 15, and the tail bud is stages 28 to 30 (31). In all panels, the positions of the molecular mass markers are indicated on the right of the gels.
FIG 2
FIG 2
The knockdown of esrp1 reduces the abundance of the Ptbp1 protein. (A) An mRNA encoding a V5-tagged version of Esrp1 with the wild-type (WT) 5′ region (WT-esrp1-V5) was injected with either a control (ctrl) or the esrp1 MO in two-cell embryos. The embryos were allowed to develop until stage 15 (neurula) before protein extraction and Western blot analysis using anti-V5 and anti-Pcna (loading control) antibodies. (B) The indicated morpholinos were injected in both blastomeres of two-cell embryos. The embryos were allowed to develop until stages 28 to 30 (tail bud) before protein extraction and Western blot analysis. (C) An mRNA encoding a V5-tagged version of Ptbp1 with the wild-type 5′ region (WT-ptbp1-V5) was injected alone or in combination with the esrp1 MO in both blastomeres of two-cell embryos. The embryos were allowed to develop until stages 28 to 30 before protein extraction for Western blot analysis using anti-Ptbp1, anti-V5, and anti-Pcna (loading control) antibodies. Endo., endogenous. (D) esrp1 MO and/or an mRNA encoding a V5-tagged version of Esrp1 immune to the esrp1 MO (esrp1-V5 mRNA) was injected in both blastomeres of two-cell embryos. The embryos were allowed to develop until stage 15 before protein extraction and Western blot analysis. (E) The indicated morpholinos were injected in both blastomeres of two-cell embryos. The embryos were allowed to develop until stage 35 (tadpole), and the presence of blisters was recorded. (Left) Representative embryos (arrows point to the blisters); (right) quantification of the blister phenotype. (F) An mRNA encoding a V5-tagged version of Ptbp1 (which is immune to the ptbp1 MO) and/or the indicated morpholinos were injected in both blastomeres of two-cell embryos. The embryos were allowed to develop until stages 28 to 30. The total RNAs were extracted and quantified by semiquantitative RT-PCR with a forward primer hybridizing to the constitutive exon 8 and a reverse primer hybridizing to the nonmuscular exon 9D of tpm1a mRNA, to amplify the nonmuscular (O5) isoform (Fig. 1B). Primers specific for eef1a1 mRNAs were also used. (Left) Results of a representative experiment; (right) quantification from 3 independent experiments (mean ± SD). The tpm1a-O5/eef1a1 ratios were normalized by the ratio in the noninjected embryos in each experiment to correct for the different specific activities of the radiolabeled primers. (G) Quantification by real-time PCR of ptbp2 mRNA abundance relative to eef1a1 mRNA abundance in embryos injected with the same molecules used for the assay whose results are presented in panel F (mean ± SD from 3 independent experiments).
FIG 3
FIG 3
The knockdown of esrp1 reduces the abundance of ptbp1 mRNA but not that of ptbp1 pre-mRNA. (A) Positions of the primers in ptbp1 RNA used for real-time PCR. (B) Both blastomeres of two-cell embryos were injected with the esrp1 MO or left noninjected (NI). The development of the embryos was arrested at stages 28 to 30 for RNA extraction. The abundance of ptbp1 mRNA relative to that of eef1a1 mRNA was determined by real-time RT-PCR (mean ± SD from 5 independent experiments). Primers hybridizing to the indicated exons (identified by the prefix e on the x axis) were used. The P values of Student's t tests are given above the bars. (C) Same as panel B, except that pairs of primers directed against the indicated intron (i)-exon (e) junctions were used to amplify ptbp1 pre-mRNA. No amplification occurred in control experiments performed without reverse transcriptase.
FIG 4
FIG 4
Self-regulatory feedback loop of ptbp1 expression in Xenopus epidermis. The ptbp1 MO or an mRNA encoding a V5-tagged version of Ptbp1 protein (ptbp1-V5 mRNA) was injected in both blastomeres of two-cell embryos. The embryos were allowed to develop until stages 28 to 30. The epidermis and the somites were dissected, or the embryos were left intact before protein and RNA extractions. (A) From top to bottom, Western blots using antibodies against Ptbp1, the V5 tag, and Pcna (loading control); results of one representative semiquantitative RT-PCR experiment using primers targeting eef1a1 and ptbp1 mRNAs, where the reverse primer targets the 3′ untranslated region of endogenous (endog.) ptbp1 mRNA (exon 15) and does not amplify the injected recombinant mRNA; and quantification of the ptbp1/eef1a1 mRNA ratios (mean ± SD from 3 independent experiments). (B) (Top) Schematic drawing of ptbp1 pre-mRNA. Exon 11 is either spliced or skipped. The arrows reveal the positions of the PCR primers (forward primer in exon 10 and reverse primer in exon 13). (Middle) Results of a representative semiquantitative RT-PCR. (Bottom) The percentage of ptbp1 mRNA excluding exon 11 (dark gray, ptbp1 mRNA without exon 11/total ptbp1 mRNA) and the total ptbp1/eef1a1 mRNA ratios (light gray) from 3 independent experiments (mean ± SD).
FIG 5
FIG 5
Control of ptbp1 mRNA splicing pattern by Esrp1. (A and B) The indicated molecules were injected in both blastomeres of two-cell embryos. The embryos were allowed to develop until stage 15 (A) or stages 28 to 30 (B) before RNA extraction. The splicing pattern of ptbp1 mRNA was analyzed as described in the legend to Fig. 4B. (Top) Results of one representative experiment; (bottom) quantifications (mean ± SD from 3 independent experiments). (A) Injection of esrp1 MO and/or a recombinant esrp1-V5 RNA immune to the esrp1 MO. (B) Injection of morpholinos (60 ng control MO, 20 ng ptbp1 MO, 10, 20, or 40 ng esrp1 MO). (C) (Top) Schematic drawing of ptbp1 pre-mRNA. Usage of the proximal (prox.) 5′ splice site (ss) in intron 2 produces an mRNA with a short exon 2 (exon 2a). The arrows in exons 1 and 3 reveal the positions of the PCR primers. (Middle and bottom) Results of one representative experiment (middle) and quantifications (bottom; mean ± SD from 3 independent experiments), as in panel A. (D) (Top) Structure of the minigene, which encompasses the keratin promoter and the region of the ptbp1 gene between exons 10 and 12. The splicing pattern of the RNA transcribed from the minigene is assayed using primers flanking exon 11 (arrows). This assay is insensitive to the endogenous ptbp1 mRNA because both primers target vector (v) sequences and are therefore specific to the minigene. (Bottom) The minigene was injected with the indicated MO in one blastomere of two-cell embryos. The embryos were arrested at stages 28 to 30, before RNA extraction and analyses of splicing pattern. (Bottom) Quantification from 3 independent experiments (mean ± SD).
FIG 6
FIG 6
Esrp1 binds to ptbp1 pre-mRNA. (A) An mRNA encoding a V5-tagged Esrp1 protein was injected in both blastomeres of two-cell embryos that were allowed to develop until stage 15. The V5-tagged protein was immunoprecipitated using anti-V5 antibodies or IgGs for mock immunoprecipitations. (Top) The input, the flowthrough (FT), and the immunoprecipitated fractions analyzed by Western blotting using antibodies against V5, Ptbp1, and Pcna. Equivalent amounts of the input, flowthrough, and eluates were loaded. (Bottom) Measurement of the amounts of ptbp1 pre-mRNA and mRNA in the immunoprecipitated fractions relative to the input amount using primers for the indicated intron (i) and exon (e) pairs. These immunoprecipitated fraction-to-input ratios (mean ± SD) result from 3 independent anti-V5 and mock immunoprecipitations. (B) (Left) Matrices were obtained by PCR amplification using combinations of forward and reverse primers, indicated by arrows. They were used for in vitro transcription to obtain 4 radiolabeled RNAs encompassing different fragments of intron 10, exon 11, and intron 11 of ptbp1 pre-mRNA. IP, immunoprecipitation. (Right) The in vitro transcripts were incubated in protein extracts made from embryos previously injected with esrp1-V5 mRNA (top) or ptbp1-V5 mRNA (middle) or left uninjected (bottom). After UV cross-linking and RNase treatment, the V5-tagged proteins were immunoprecipitated, electrophoresed, and revealed by autoradiography.
FIG 7
FIG 7
Model for the control of Ptbp1 abundance. The ptbp1 pre-mRNA matures into two isoforms differing by the presence of exon 11. The isoform devoid of exon 11 (right) contains a premature stop codon and is targeted to rapid degradation by NMD. The isoform containing exon 11 (left) is translated into the Ptbp1 protein. Exon 11 is spliced with a low efficiency, and Esrp1 is required to achieve exon 11 inclusion and, thereby, Ptbp1 accumulation in the epidermis. Ptbp1 counteracts Esrp1 to favor exon 11 skipping, which provides the basis for the ptbp1 self-regulatory feedback loop. Rbm4 also reduces exon 11 inclusion in muscle, heart, and, potentially, other tissues. Additional unknown trans-acting factors X may stimulate exon 11 splicing or skipping.

Similar articles

Cited by

References

    1. Pan Q, Shai O, Lee LJ, Frey BJ, Blencowe BJ. 2008. Deep surveying of alternative splicing complexity in the human transcriptome by high-throughput sequencing. Nat Genet 40:1413–1415. doi:10.1038/ng.259. - DOI - PubMed
    1. Wang ET, Sandberg R, Luo S, Khrebtukova I, Zhang L, Mayr C, Kingsmore SF, Schroth GP, Burge CB. 2008. Alternative isoform regulation in human tissue transcriptomes. Nature 456:470–476. doi:10.1038/nature07509. - DOI - PMC - PubMed
    1. Manley JL, Tacke R. 1996. SR proteins and splicing control. Genes Dev 10:1569–1579. doi:10.1101/gad.10.13.1569. - DOI - PubMed
    1. Jensen KB, Dredge BK, Stefani G, Zhong R, Buckanovich RJ, Okano HJ, Yang YY, Darnell RB. 2000. Nova-1 regulates neuron-specific alternative splicing and is essential for neuronal viability. Neuron 25:359–371. doi:10.1016/S0896-6273(00)80900-9. - DOI - PubMed
    1. Singh R, Valcarcel J. 2005. Building specificity with nonspecific RNA-binding proteins. Nat Struct Mol Biol 12:645–653. doi:10.1038/nsmb961. - DOI - PubMed

MeSH terms

LinkOut - more resources