. 2014;15(12):555.
doi: 10.1186/s13059-014-0555-3.

Determining the quality and complexity of next-generation sequencing data without a reference genome

Determining the quality and complexity of next-generation sequencing data without a reference genome

Seyed Yahya Anvar et al. Genome Biol. 2014.

Abstract

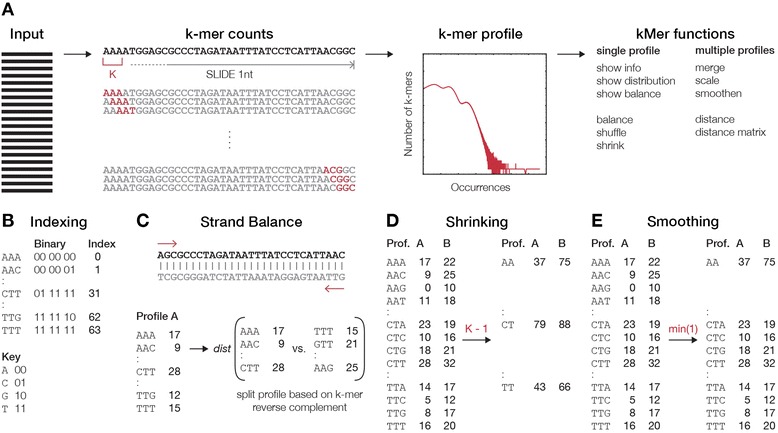
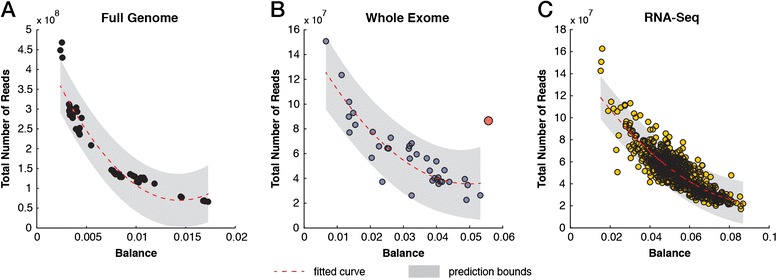
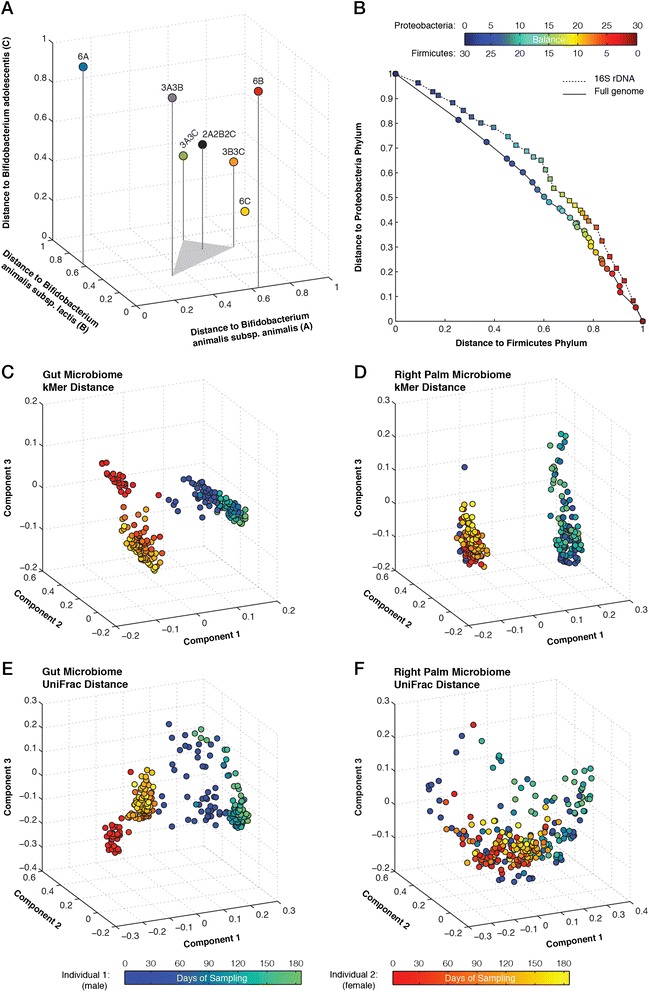
We describe an open-source kPAL package that facilitates an alignment-free assessment of the quality and comparability of sequencing datasets by analyzing k-mer frequencies. We show that kPAL can detect technical artefacts such as high duplication rates, library chimeras, contamination and differences in library preparation protocols. kPAL also successfully captures the complexity and diversity of microbiomes and provides a powerful means to study changes in microbial communities. Together, these features make kPAL an attractive and broadly applicable tool to determine the quality and comparability of sequence libraries even in the absence of a reference sequence. kPAL is freely available at https://github.com/LUMC/kPAL webcite.


Figures

Figure 1
Figure 1
Schematic overview of main kPAL principles. (A) An overview of the procedure used by kPAL to assess the frequency of all k-mers within sequencing data. k-mers are identified and counted by a sliding window of size k. The k-mer spectrum can then be produced using the k-mer frequencies. The main functions of kPAL can be divided by their application to single or multiple profiles. For single k-mer profiles, general information about the number of nullomers, total number of counts, distribution of k-mer counts and balance between sequencing information from the plus and minus strands can be obtained with dedicated functions. If needed, profiles can be manipulated by the balance, shuffle and shrink functions. The balance function uses a sum of k-mers and their reverse complements to enforce balance between sequence information from the minus or plus strand. The shuffle function is designed to produce random k-mer profiles without changing the overall distribution of counts. (B) kPAL efficiently processes k-mers, as it encodes the sequences with a binary code using specific keys that can also facilitate a quick conversion to the reverse complement. Each nucleotide is represented by a binary code that is subsequently used to construct each k-mer. (C) The strand balance of a given k-mer profile is the overall distance measure between the frequency of the unique k-mer and its reverse complement. Thus, k-mer profiles are split into two sub-profiles that are reverse complements of each other and these are used to calculate the strand balance. (D) By design, kPAL can shrink k-mer profiles of size k to any smaller size. Counts from k-mers that share the first (n – 1) nucleotides are merged to collapse k-mer profiles to a size k – 1. (E) The smoothing function borrows the utility of shrinking and applies it locally to only k-mers that have lower counts than one defined by the user. Thus, for those affected, k-mer counts are merged and dropped to the size k – 1. The smoothing function accepts thresholds for the minimum, maximum or average counts of k-mers that share the first (n – 1) nucleotides but it also accepts user-defined functions. This process reiterates until the threshold condition is met. Prof., profile.
Figure 2
Figure 2
Evaluating data quality for mRNA sequencing samples across different laboratories. (A) Scatter plot showing for each sample the median pairwise Spearman correlation for exon quantification and the median k-mer distance measures (K distance) after scaling. Problematic samples are highlighted in different colors. (B) Histogram of median K distance (scaled) for each individual sample. (C) Distribution of median K distance (scaled) for each sequencing laboratory (indicated by different colors). (D) Scatter plot of median pairwise Spearman correlation between exon quantification and K distance (smoothed and scaled). (E) Histogram of median K distance (smoothed and scaled) for each individual sample. (F) Distribution of median K distance (smoothed and scaled) for each sequencing laboratory (indicated by different colors). (G) Scatter plot of the total number of reads per sample versus the K distance of 9-mers (scaled). The poly2 fitted line and the 95% confidence intervals are indicated. (H) Scatter plot of the total number of reads per sample versus the K distance of 12-mers (scaled). (I) Scatter plot of the total number of reads per sample versus the K distance of 12-mers (smoothed and scaled). Lab, laboratory; QC, quality control.
Figure 3
Figure 3
Data quality and the influence of library preparation protocol in whole genome sequencing data. (A) Hierarchical clustering of pairwise k-mer distance measures across WGS samples. Samples prepared using different protocols are indicated in different colors. (B) Percentage of aligned reads per sample. Black and grey bars separate samples from different individuals. Red and blue circles indicate the choice of library preparation protocol. (C) Percentage of duplicated reads. (D) Percentage of properly paired reads. (E) Percentage of paired reads that map to different chromosomes. (F) Distribution of average GC content per read. Samples prepared using different protocols are colored accordingly. (G) Distribution of estimated insert size. (H) Distribution of the number of base pairs that are soft clipped from reads during the alignment. Diff, different; WGS, whole genome sequencing.
Figure 4
Figure 4
k -mer distances in whole exome sequencing data are associated with data quality and choice of capture protocol. (A) PCA of pairwise distance measures. Blue circles indicate samples with poor capture performance. The red circles highlight the WE10_F1L3_NIM sample, which suffers from multiple problems. Samples that passed the QC measures are indicated by different types of black circle based on the choice of capture kit (Nimblegen or Agilent SureSelect). (B) Hierarchical clustering of pairwise k-mer distance measures across WES samples. Different clusters are indicated by color. AGI, Agilent SureSelect; NIM, Nimblegen; PCA, principal component analysis; QC, quality control; WES, whole exome sequencing.
Figure 5
Figure 5
Detecting the balance in coverage depth of plus and minus strands in sequencing data. (A) Scatter plot of distance between the frequencies of k-mers and their reverse complement (balance) versus the total number of reads in WGS data. The poly2 fitted line and the 95% confidence intervals are indicated. (B) Scatter plot of balance versus the total number of reads in WES data. The red circle indicates an outlier with an extreme duplication rate and imbalance of coverage between the plus and minus strands. (C) Scatter plot of balance versus the total number of reads in RNA-Seq data. RNA-Seq, RNA sequencing; WES, whole exome sequencing; WGS, whole genome sequencing.
Figure 6
Figure 6
Resolving the level of relatedness between microbiomes. (A) Three-dimensional scatter plot of the k-mer distance measures for a series of metagenomes with different copy number of three closely related species. (B) Scatter plot of the relative distance between Firmicutes and Proteobacteria phyla. Each data point represents a metagenome with a differing number of species from each phylum. Data points are colored according to the number of species from each phylum. (C) PCA plot of pairwise k-mer distance measures for gut microbiomes. Data points are colored based on the origin of the sample (male in blue and female in red) and time. (D) PCA plot of pairwise k-mer distance measures for right-palm microbiomes. (E) PCA plot of pairwise UniFrac distance measures for gut microbiomes. (F) PCA plot of pairwise UniFrac distance measures for right-palm microbiomes. PCA, principal component analysis.

References

    1. Goldstein DB, Allen A, Keebler J, Margulies EH, Petrou S, Petrovski S, Sunyaev S. Sequencing studies in human genetics: design and interpretation. Nat Rev Genet. 2013;14:460–470. doi: 10.1038/nrg3455. - DOI - PMC - PubMed
    1. Nekrutenko A, Taylor J. Next-generation sequencing data interpretation: enhancing reproducibility and accessibility. Nat Rev Genet. 2012;13:667–672. doi: 10.1038/nrg3305. - DOI - PubMed
    1. Costello M, Pugh TJ, Fennell TJ, Stewart C, Lichtenstein L, Meldrim JC, Fostel JL, Friedrich DC, Perrin D, Dionne D, Kim S, Gabriel SB, Lander ES, Fisher S, Getz G. Discovery and characterization of artifactual mutations in deep coverage targeted capture sequencing data due to oxidative DNA damage during sample preparation. Nucleic Acids Res. 2013;41:e67. doi: 10.1093/nar/gks1443. - DOI - PMC - PubMed
    1. Alkan C, Coe BP, Eichler EE. Genome structural variation discovery and genotyping. Nat Rev Genet. 2011;12:363–376. doi: 10.1038/nrg2958. - DOI - PMC - PubMed
    1. Kidd JM, Sampas N, Antonacci F, Graves T, Fulton R, Hayden HS, Alkan C, Malig M, Ventura M, Giannuzzi G, Kallicki J, Anderson P, Tsalenko A, Yamada NA, Tsang P, Kaul R, Wilson RK, Bruhn L, Eichler EE. Characterization of missing human genome sequences and copy-number polymorphic insertions. Nat Methods. 2010;7:365–371. doi: 10.1038/nmeth.1451. - DOI - PMC - PubMed

Publication types

LinkOut - more resources