. 2015 Mar 31;35(4):592-600.
doi: 10.1038/jcbfm.2014.230.

Intracranial pressure elevation after ischemic stroke in rats: cerebral edema is not the only cause, and short-duration mild hypothermia is a highly effective preventive therapy

Affiliations

Intracranial pressure elevation after ischemic stroke in rats: cerebral edema is not the only cause, and short-duration mild hypothermia is a highly effective preventive therapy

Lucy A Murtha et al. J Cereb Blood Flow Metab. .

Erratum in

Abstract

In both the human and animal literature, it has largely been assumed that edema is the primary cause of intracranial pressure (ICP) elevation after stroke and that more edema equates to higher ICP. We recently demonstrated a dramatic ICP elevation 24 hours after small ischemic strokes in rats, with minimal edema. This ICP elevation was completely prevented by short-duration moderate hypothermia soon after stroke. Here, our aims were to determine the importance of edema in ICP elevation after stroke and whether mild hypothermia could prevent the ICP rise. Experimental stroke was performed in rats. ICP was monitored and short-duration mild (35 °C) or moderate (32.5 °C) hypothermia, or normothermia (37 °C) was induced after stroke onset. Edema was measured in three studies, using wet-dry weight calculations, T2-weighted magnetic resonance imaging, or histology. ICP increased 24 hours after stroke onset in all normothermic animals. Short-duration mild or moderate hypothermia prevented this rise. No correlation was seen between ΔICP and edema or infarct volumes. Calculated rates of edema growth were orders of magnitude less than normal cerebrospinal fluid production rates. These data challenge current concepts and suggest that factors other than cerebral edema are the primary cause of the ICP elevation 24 hours after stroke onset.


Figures
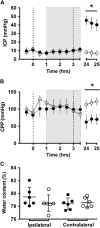
Figure 1
Figure 1
Study I—moderate hypothermia (32.5 °C), Wistar rats. (A) Intracranial pressure (ICP) 0 to 3.5 hours and 24 to 25 hours after MCAo in hypothermia-treated (open circles) and normothermia (closed circles) animals, the shaded region represents the cooling interval; MCAo is between the dotted vertical lines. (B) Cerebral perfusion pressure (CPP). CPP was calculated as arterial pressure minus ICP. (C) Brain-water content measured with wet–dry weight calculations for ipsilateral and contralateral hemispheres in hypothermia-treated (open circles) and normothermia (closed circles) animals. (A) and (B) data plotted as mean±s.d. (C). Individual animals, mean±s.d. *P<0.0001, for t-tests between respective hypothermia (open circles; n=6) and normothermia (closed circles; n=6) groups. MCAo, middle cerebral artery occlusion.
Figure 2
Figure 2
Study II—moderate hypothermia (32.5 °C), Sprague–Dawley rats. (A) Intracranial pressure (ICP) at baseline (pre-stroke, 0 hours) and 24 hours after MCAo in hypothermia-treated (open circles) and normothermia (closed circles) animals. (B) Cerebral perfusion pressure (CPP). CPP was calculated as arterial pressure minus ICP. (C) Infarct volume measured with T2-weighted magnetic resonance imaging (MRI). (D) Cerebral edema volume measured with T2-weighted MRI. Individual animal data plotted, and mean±s.d. *P<0.0001, P<0.05 for t-tests between respective hypothermia (open circles; n=6) and normothermia (closed circles; n=6) groups. MCAo, middle cerebral artery occlusion.
Figure 3
Figure 3
Study II—representative magnetic resonance imaging (MRI) scans at 24 hours after MCAo. (A) Gadolinium contrast was infused intravenously and a T1-weighted MRI scan was obtained to determine the area of blood–brain barrier (BBB) breakdown. The area of BBB breakdown is depicted by the area of pallor. (B) This area was traced and overlaid onto the same slice on the T2-weighted MRI scan (yellow line). The area of hyperintensity of the T2-weighted scan is representative of infarct (red line). MCAo, middle cerebral artery occlusion; MRI, magnetic resonance imaging.
Figure 4
Figure 4
Study III—mild hypothermia (35 °C), Wistar rats. (A) Intracranial pressure (ICP) 0 to 3.5 hours and 24 to 25 hours after MCAo in hypothermia-treated (open circles) and normothermia (concurrent controls, closed circles; historical controls, closed squares) animals; the shaded region represents the cooling interval; MCAo is between the dotted vertical lines. (B) Cerebral perfusion pressure (CPP). CPP was calculated as arterial pressure minus ICP. (C) Infarct volume measured with hematoxylin and eosin (H&E) histology. (D) Cerebral edema volume measured with H&E histology. (A and B) mean±s.d. (C and D) Individual animals, mean±s.d. *P<0.0001, P<0.05 for t-tests between respective hypothermia (open circles; n=6) and normothermia (closed circles/squares; n=3 concurrent+n=10 historical controls) groups. MCAo, middle cerebral artery occlusion.
Figure 5
Figure 5
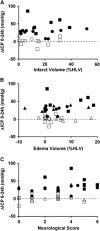
Studies I—III: Illustrative comparison of change in intracranial pressure (ΔICP) versus (A) infarct volume (%HLV), (B) cerebral edema volume (%HLV), and (C) neurologic deficit score. Study I is represented by triangles; Study II is represented by squares; Study III is represented by circles. Normothermia closed shapes, hypothermia open shapes. To account for minor differences in baseline ICP between Wistar and Sprague–Dawley rats, data are presented as (delta) ICP. No significant correlation of ΔICP with infarct volume (%HLV), edema volume (%HLV), or neurological deficit scores was seen in each study. Study I—n=6/group; Study II—n=6/group; Study III—n=6 hypothermia; n=3 concurrent+n=10 historical controls.

References

    1. Hacke W, Schwab S, Horn M, Spranger M, De Georgia M, von Kummer R. 'Malignant' middle cerebral artery territory infarction: clinical course and prognostic signs. Arch Neurol. 1996;53:309–315. - PubMed
    1. Ropper AH, Shafran B. Brain edema after stroke. Clinical syndrome and intracranial pressure. Arch Neurol. 1984;41:26–29. - PubMed
    1. Schwab S, Schwarz S, Spranger M, Keller E, Bertram M, Hacke W. Moderate hypothermia in the treatment of patients with severe middle cerebral artery infarction. Stroke. 1998;29:2461–2466. - PubMed
    1. Morley NC, Berge E, Cruz-Flores S, Whittle IR. Surgical decompression for cerebral oedema in acute ischaemic stroke. Cochrane Database Syst Rev. 2002. - PubMed
    1. Murtha LA, McLeod DD, McCann SK, Pepperall D, Chung S, Levi CR, et al. Short-duration hypothermia after ischemic stroke prevents delayed intracranial pressure rise. Int J Stroke. 2014;9:553–559. - PubMed

Publication types