. 2014 Dec 16:9:57.
doi: 10.1186/1750-1326-9-57.

The cognitive defects of neonatally irradiated mice are accompanied by changed synaptic plasticity, adult neurogenesis and neuroinflammation

Affiliations

The cognitive defects of neonatally irradiated mice are accompanied by changed synaptic plasticity, adult neurogenesis and neuroinflammation

Stefan J Kempf et al. Mol Neurodegener. .

Abstract

Background/purpose of the study: Epidemiological evidence suggests that low doses of ionising radiation (≤1.0 Gy) produce persistent alterations in cognition if the exposure occurs at a young age. The mechanisms underlying such alterations are unknown. We investigated the long-term effects of low doses of total body gamma radiation on neonatally exposed NMRI mice on the molecular and cellular level to elucidate neurodegeneration.

Results: Significant alterations in spontaneous behaviour were observed at 2 and 4 months following a single 0.5 or 1.0 Gy exposure. Alterations in the brain proteome, transcriptome, and several miRNAs were analysed 6-7 months post-irradiation in the hippocampus, dentate gyrus (DG) and cortex. Signalling pathways related to synaptic actin remodelling such as the Rac1-Cofilin pathway were altered in the cortex and hippocampus. Further, synaptic proteins MAP-2 and PSD-95 were increased in the DG and hippocampus (1.0 Gy). The expression of synaptic plasticity genes Arc, c-Fos and CREB was persistently reduced at 1.0 Gy in the hippocampus and cortex. These changes were coupled to epigenetic modulation via increased levels of microRNAs (miR-132/miR-212, miR-134). Astrogliosis, activation of insulin-growth factor/insulin signalling and increased level of microglial cytokine TNFα indicated radiation-induced neuroinflammation. In addition, adult neurogenesis within the DG was persistently negatively affected after irradiation, particularly at 1.0 Gy.

Conclusion: These data suggest that neurocognitive disorders may be induced in adults when exposed at a young age to low and moderate cranial doses of radiation. This raises concerns about radiation safety standards and regulatory practices.


Figures
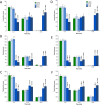
Figure 1
Figure 1
Analysis of spontaneous behaviour. Spontaneous behaviour of 2-month-old (A, B and C) and 4-month-old (D, E and F) NMRI male mice were exposed to 0, 0.02, 0.1, 0.5 or 1.0 Gy gamma radiation on postnatal day 10. The data were subjected to an ANOVA with split-plot design and significant treatment × time interactions were observed for 2-month-old and 4-month-old behaviour including locomotion, rearing, and total activity. Pairwise testing between control animals and animals exposed to gamma radiation was performed using Duncan’s MRT test. The statistical differences are indicated as: (A) significantly different vs. control, p ≤ 0.01; (a) significantly different vs. control, p ≤ 0.05; (B) significantly different vs. 0.02 Gy, p ≤ 0.01; (b) significantly different vs. 0.02 Gy, p ≤ 0.05; (C) significantly different vs. 0.1 Gy, p ≤ 0.01; (c) significantly different vs. 0.1 Gy, p ≤ 0.05; (D) significantly different vs. 0.5 Gy, p ≤ 0.01; (d) significantly different vs. 0.5 Gy, p ≤ 0.05; n = 12 per exposure group.
Figure 2
Figure 2
Analysis of signalling pathways from proteomic experiments. Venn diagrams of deregulated proteins from cortex [C] (A) and hippocampus [H] (B) exposed to 0.02 Gy, 0.1 Gy, 0.5 Gy and 1.0 Gy from global proteomics approach are shown. H: n = 4; C: n = 5. The number above each dose shows the total number of deregulated proteins at this dose. The unique and overlapping significantly deregulated proteins in hippocampus and cortex at doses of 0.5 Gy and 1.0 Gy are shown in panel C. Each column shows the proteins significantly up-regulated (bold) or down-regulated (italic) with the fold-changes in brackets. Proteins indicated with a and/or b belong to the protein class of “small GTPase/associated G-protein” and/or “cytoskeleton / cytoskeleton-binding protein”, respectively, as categorised using the PANTHER software tool and UniProt database. Hippocampal and cortical data result from four and five biological replicates. Associated signalling pathways of all dose-dependent significantly deregulated proteins using the Ingenuity Pathway Analysis (IPA) software are shown in panel D. Higher colour intensity represents higher significance (p-value) whereas all coloured boxes have a p-value of ≤ 0.05; white boxes have p-value of > 0.05 and are not significant. Hippocampal and cortical data result from four and five biological replicates, respectively. H: Hippocampus, C: Cortex. Panel E shows the overlapping proteins within the in panel D depicted signalling pathways.
Figure 3
Figure 3
The Rac1-Cofilin signalling pathway and subsequent analysis of involved molecules. The Rac1-Cofilin signalling pathway is shown (A). Signalling from AMPA, NMDA and GPC receptors leads to activation (phosphorylation) of Rac1 via LTP / LTD. This leads to downstream activation (phosphorylation) of PAK1/3, LIMK1 and final inactivation of cofilin via phosphorylation. Cdc42 is also able to phosphorylate PAK1/3. Associated microRNAs are miR-132 regulating Rac1 activity via modulation of a GTP hydrolysis protein (p250GAP) and miR-134 directly suppressing LIMK1 levels. Rac1 activity is regulated via phosphorylation of RhoGDI releasing Rac1 from RhoGDI inhibitory complex. Data from immunoblots (B - E) and quantification of miRNAs associated with the Rac1-Cofilin pathway (F) are shown in hippocampus and cortex from control, and exposed mice (0.5 and 1.0 Gy). The columns represent the fold-changes with standard errors of the mean (SEM) from three biological replicates. The visualisation of protein bands shows the representative change from three biological replicates. *p < 0.05; **p < 0.01; ***p < 0.001 (unpaired Student’s t-test). Normalisation was performed against endogenous GAPDH and endogenous snoRNA135 for immunoblotting and miRNA quantification, respectively. Gene expression analysis of Limk1 in cortex [C] and hippocampus [H] exposed to sham-irradiation, 0.5 Gy and 1.0 Gy is shown in panel G. Columns represent fold-changes with the standard error of the mean (SEM) from 3 biological replicates. Statistical analysis was performed with unpaired Student’s t-test; H: Hippocampus, C: Cortex.
Figure 4
Figure 4
Analysis of synaptic proteins via sequential immunofluorescence in hippocampus and dentate gyrus. Data from sequential immunofluorescence from hippocampus (H) and dentate gyrus (DG) at different doses are shown (A and B). The columns represent the fold-changes with standard errors of the mean (SEM) from three biological replicates. The visualisation shows the representative intensity from three biological replicates of 0 Gy and 1.0 Gy regarding MAP-2 (red - Microtubule-associated protein 2), PSD-95 (green - Disks large homolog 4 (DLG4), Hoechst (blue) and merged intensities within the hippocampal region. The MAP-2 / PSD-95 intensity was normalised against nuclear Hoechst intensity in the region of interest. *p < 0.05; **p < 0.01; ***p < 0.001 (unpaired Student’s t-test); magnification: 4x. Representative images of sequential immunofluorescence from hippocampus are shown in panel C. Images indicate the specific binding of secondary antibodies (“negative control”), binding sites of primary MAP-2 antibody saturated via Cy3-Fab-fragment IgG (“MAP-2 + sec. Ab’s”) and sequential immunofluorescence with a single protein detection (“Only MAP-2” and “Only PSD-95”). “Negative control” – only secondary antibodies and Hoechst; “only MAP-2” – primary antibody against MAP-2, Cy3-Fab-fragment IgG secondary antibody, Hoechst; “only PSD-95” – primary antibody against PSD-95, Alexa-fluor IgG secondary antibody, Hoechst; “MAP-2 + sec. Ab’s” – primary antibody against MAP-2, Cy3-Fab-fragment IgG secondary antibody, Alexa-fluor IgG secondary antibody, Hoechst; magnification: 4x.
Figure 5
Figure 5
Quantification of the expression of genes and proteins involved in synaptic plasticity. Genes significantly changed in expression from hippocampus and cortex at doses of 0.5 Gy and 1.0 Gy using RT2 Profiler PCR Arrays are shown in A. The table shows the genes which are significantly up-regulated or down-regulated with the fold-changes in brackets; *p < 0.05; **p < 0.01; ***p < 0.001 (unpaired Student’s t-test, n = 3) after normalisation to the median of 84 target genes. Immunoblots and quantification of Arc, c-Fos, total CREB and phosphorylated CREB in hippocampus and cortex of sham-irradiated and 1.0 Gy irradiated mice 7 months post irradiation (B and C). The columns represent the fold-changes with standard errors of the mean (SEM) from three biological replicates. The visualisation of protein bands shows the representative change using three biological replicates. *p < 0.05; **p < 0.01; ***p < 0.001 (unpaired Student’s t-test). Normalisation was performed against endogenous GAPDH; H: Hippocampus, C: Cortex.
Figure 6
Figure 6
Adult neurogenesis and evaluation of apoptosis, DNA strands and derivations in animal and brain weights. Schematic representation of proneural markers for staging adult neurogenesis in the hippocampus by immunohistochemistry is shown (A). Representative image of stem-like cells (type 1 radial glial) labelled by GFAP (B), of proliferating progenitor cells (type 2a) labelled with PCNA (D) and Ki67 (F), of non-radial stem cells (type 2b) labeled by Sox2 (H), of newborn and mature neurons labeled by Dcx (J) and NeuN (L) and corresponding relative quantifications (C, E, G, I, K, M) are shown. NeuN+ cells were counted in 4000 μm2 areas (in green). *p < 0.05; **p < 0.01; ***p < 0.001 (unpaired Student’s t-test). Data are reported as mean ± SEM (n = 3 for Ki67, n ≥ 3 for NeuN, others n = 6); DG, dentate gyrus; CR, crest area; SB, suprapyramidal blade; IB, infrapyramidal blade. Visualisation of activated Caspase-3 (N) and γH2AX (O) in hippocampus and DG and fold-changes of brain weight, body weight and their ratios (P) are shown. The positive control of γH2AX consisted of hippocampus irradiated with 3.0 Gy and stained after 30 minutes. Data of weights are reported as fold-changes ± SEM from at least 5 biological replicates (Student’s t-test, unpaired).
Figure 7
Figure 7
Evaluation of neuroinflammation, astrogliosis and oxidative stress. Immunostaining for CD11b showing significantly increased expression in dentate gyrus (DG), molecular layer (ML) and hilus (HL) after irradiation with 1.0 Gy compared to sham-irradiated controls (A and B) is shown. Gene expression analysis/immunoblots of TNFα, phospho-IGF1Rβ/INSRβ within the hippocampus [H] is shown (C and D). Figure E and F show immunostaining for GFAP with a significant increase in the number of astrocytes in the hilus after irradiation with 0.1 Gy, 0.5 Gy and 1.0 Gy compared to sham-irradiated controls. Immunoblot of total malondialdehyde (MDA)-tagged proteins within the hippocampus [H] is shown (G and H). The visualisation of protein bands shows the representative change from the biological replicates; MDA content quantification was performed with 5 bands in the range of 35 kDa to 55 kDa after a total lane normalisation. All data are reported as mean/fold-change ± SEM (n = 5 for immunohistochemistry; n = 4 for immunoblotting against MDA content; n = 3 for gene expression and other immunoblots); *p < 0.05; **p < 0.01; ***p < 0.001 (unpaired Student’s t-test). Immunoblot of total malondialdehyde (MDA)-tagged proteins within the cortex [C] exposed to sham-irradiation and 1.0 Gy (I) and quantification of six representative bands in the range of 25 – 70 kDa (J) are shown. Statistical analysis was performed with unpaired Student’s t-test. Data are reported as fold-change ± SEM (n = 4). The quantification of the protein bands was done using four biological replicates.
Figure 8
Figure 8
Potential mechanism of radiation-induced persistent learning and memory deficit. Schematic presentation of long-term effects of ionising radiation on the brain combining all presented data from 1.0 Gy-exposed hippocampus is shown. Microglia and astrocytes regulate neuronal activity by influencing cytokines (TNFα) or neurotrophic factors. This results in changes in the receptor profile of G protein coupled receptors (GPCR’s) and AMPA and NMDA receptors which are important for steady state signal transmission from neuron to neuron. In turn, this affects long-term potentiation/long-term depression (LTP/LTD) and leads to alterations in synaptic morphology (actin reorganisation via Rac1-Cofilin-pathway, changes in synaptic scaffold proteins such as PSD-95/MAP-2) and synaptic plasticity (CREB pathway). Phosphorylated CREB (CREB-P) regulates the expression of miR-132 and immediate early genes such as c-Fos, Arc and Crem affecting both synaptic morphology and adult neurogenesis. The connecting arrows are based on the literature mentioned in the discussion; genetic, chemical or pharmacological manipulations have to be performed to ascertain these links in detail.

Similar articles

Cited by

References

    1. Hoffman KE, Yock TI. Radiation therapy for pediatric central nervous system tumors. J Child Neurol. 2009;24:1387–1396. doi: 10.1177/0883073809342275. - DOI - PubMed
    1. Fouladi M, Gilger E, Kocak M, Wallace D, Buchanan G, Reeves C, Robbins N, Merchant T, Kun LE, Khan R, Gajjar A, Mulhern R. Intellectual and functional outcome of children 3 years old or younger who have CNS malignancies. J Clin Oncol. 2005;23:7152–7160. doi: 10.1200/JCO.2005.01.214. - DOI - PubMed
    1. Kempf SJ, Azimzadeh O, Atkinson MJ, Tapio S. Long-term effects of ionising radiation on the brain: cause for concern? Radiat Environ Biophys. 2013;52:5–16. doi: 10.1007/s00411-012-0436-7. - DOI - PubMed
    1. Hall P, Adami HO, Trichopoulos D, Pedersen NL, Lagiou P, Ekbom A, Ingvar M, Lundell M, Granath F. Effect of low doses of ionising radiation in infancy on cognitive function in adulthood: Swedish population based cohort study. BMJ. 2004;328:19. doi: 10.1136/bmj.328.7430.19. - DOI - PMC - PubMed
    1. Ron E, Modan B, Floro S, Harkedar I, Gurewitz R. Mental function following scalp irradiation during childhood. Am J Epidemiol. 1982;116:149–160. - PubMed

Publication types

LinkOut - more resources