. 2016 Mar;221(2):1067-81.
doi: 10.1007/s00429-014-0955-x. Epub 2014 Dec 17.

Sensory encoding in Neuregulin 1 mutants

Affiliations

Sensory encoding in Neuregulin 1 mutants

Claudia S Barz et al. Brain Struct Funct. 2016 Mar.

Abstract

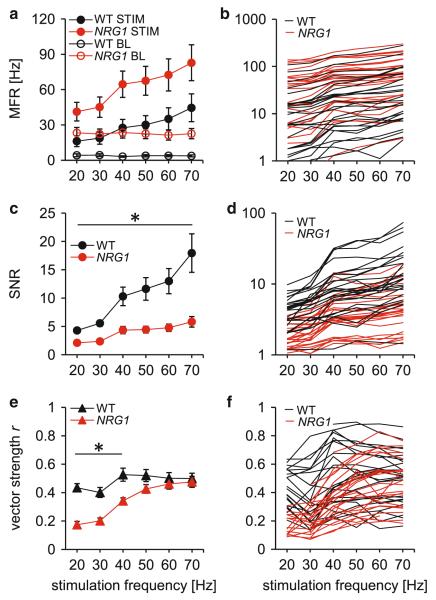
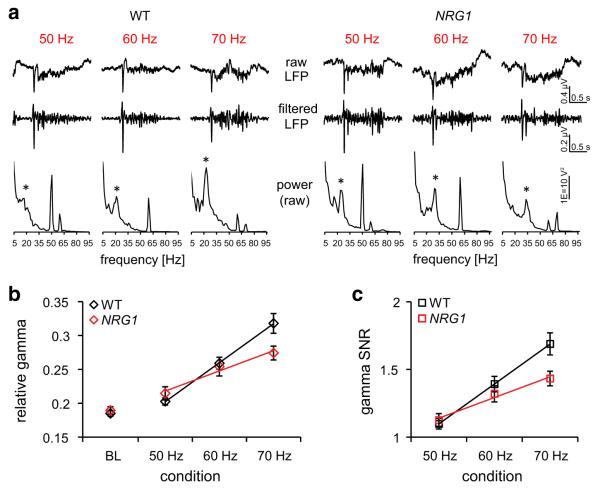
Schizophrenic patients show altered sensory perception as well as changes in electrical and magnetic brain responses to sustained, frequency-modulated sensory stimulation. Both the amplitude and temporal precision of the neural responses differ in patients as compared to control subjects, and these changes are most pronounced for stimulation at gamma frequencies (20-40 Hz). In addition, patients display enhanced spontaneous gamma oscillations, which has been interpreted as 'neural noise' that may interfere with normal stimulus processing. To investigate electrophysiological markers of aberrant sensory processing in a model of schizophrenia, we recorded neuronal activity in primary somatosensory cortex of mice heterozygous for the schizophrenia susceptibility gene Neuregulin 1. Sensory responses to sustained 20-70 Hz whisker stimulation were analyzed with respect to firing rates, spike precision (phase locking) and gamma oscillations, and compared to baseline conditions. The mutants displayed elevated spontaneous firing rates, a reduced gain in sensory-evoked spiking and gamma activity, and reduced spike precision of 20-40 Hz responses. These findings present the first in vivo evidence of the linkage between a genetic marker and altered stimulus encoding, thus suggesting a novel electrophysiological endophenotype of schizophrenia.

Keywords: Endophenotypes; Gamma oscillations; Neuregulin 1; Schizophrenia; Signal-to-noise ratio; Somatosensory cortex.


Figures

Fig. 1
Fig. 1
Recordings of sensory-evoked multi-unit activity in the mouse barrel cortex. a Recording and stimulation setup. Tetrode recordings were acquired in lightly anesthetized mice. Air puff stimuli were applied as 1 s long trains at different frequencies (20–70 Hz, repeated every 5 s) to 2–5 whiskers at a time. Contralateral responses were recorded in layers II/III and IV in the barrel field of the primary somatosensory cortex. b Example response. Raw traces from the four wires of a tetrode during 70 Hz stimulation (bottom trace). c Filtering procedure. The raw data was low-pass filtered (0.1–300 Hz) to obtain local field potentials (top panel), and high-pass filtered (0.6–6 kHz; middle panel) to obtain the local spiking activity (bottom panel). Here spontaneous activity is shown. d Spike analysis. The MUA was further analyzed off-line with SpikeSort3D to isolate single unit activity (SUA). The left column shows that for every SUA, four spike shapes recorded at four tetrode channels are available for feature analysis. Features such as the amplitude of the peak and trough were used to cluster similar spike shapes that are thought to emerge from the same neuron. In the cluster display (top left), every dot represents one spike recorded from the same tetrode in 3D feature space. Spikes with similar characteristics tend to be in closer proximity and can thus be identified as a distinct SUA. As an additional criterion, SUAs comprise less than 2 % of the spikes that occur at rates faster than every 2 ms. The interspike interval histograms of the three example SUAs, showing absence of spikes at or less than 1 ms, are displayed in the right column. e Left panel. Example of sensory-evoked MUA response in WT mice. Top-to-bottom: Responses to 20–70 Hz stimulation and example histogram (70 Hz). Left-to-right: Peri-stimulus raster plots, phase raster plots and vector strength (VS) for each stimulus frequency (every line represents one trial and every dot represents one spike). Black box indicates stimulation onset and offset (duration: 1 s). All VS values are significant at p < 0.001. Right panel. Example of sensory-evoked MUA responses from NRG1 (+/−) mice (same conventions as in WT panel)
Fig. 2
Fig. 2
Differences in stimulus-evoked responses between WT and NRG1 (+/−) mice. a, b Mean firing rate (MFR) for WT MUAs (n = 28) and NRG1 (+/−) MUAs (n = 25) during 20–70 Hz stimulation (plain circles) and baseline conditions (open circles). c, d Signal-to-noise ratio (SNR) for WT and NRG1 (+/−) MUAs during 20–70 Hz stimulations. e, f Vector strengths for WT and NRG1 (+/−) MUAs during 20–70 Hz stimulation. Average MUA results are displayed in the left column (a, c and e), and individual MUA trends are displayed in the right column (b, d and f). Error bars denote SEM; star (asterisk) indicates significant difference between groups (see Tables 1, 2 for details)
Fig. 3
Fig. 3
Reduced sensory gamma oscillations in NRG1 (+/−) mice. a Example LFP response and power during high frequency (50–70 Hz) stimulation in a WT mouse (left panel) and an NRG1 (+/−) mouse (right panel). Top-to-bottom: Single-trial raw LFP trace, filtered LFP trace (10–50 Hz) and power spectrum of the raw LFP. The power was measured across all stimulus trials and thus reflects induced, non-locked components. Power peaks appear in the gamma range (20–40 Hz; indicated by asterisk), at the stimulation frequency (reflecting stimulus-evoked activity) and at 60 Hz (reflecting electrical noise). b Gamma power during baseline (BL) and stimulation (50–70 Hz) conditions. Relative gamma power was calculated as the ratio of absolute gamma (20–40 Hz) and total power (5–100 Hz). Shown are the average gamma values for 36 WT LFPs (black diamonds) and 32 NRG1 (+/−) LFPs (red diamonds), with additional trend lines reflecting average differences in gain between WT (black line) and NRG1 (+/−) responses (red line) across the stimulation conditions. The increase in relative gamma power across 50–70 Hz was measured for each LFP with a linear fit using the least squares method. WT mice displayed a higher gain in relative gamma power than NRG1 (+/−) mice (Mann–Whitney, U = 889, p < 0.001). c Gamma SNR across 50–70 Hz. Gamma SNR was quantified by dividing relative gamma power during stimulation by relative gamma power during baseline for each LFP response (shown in b). Displayed are average gamma SNR values for WT mice (black squares) and NRG1 (+/−) mice (red squares). Trend lines indicate the increase, or gain, in gamma SNR across frequencies for WT (black line) and NRG1 (+/−) mice (red line). The gain was calculated by fitting a linear function to the gamma SNR during 50–70 Hz stimulation. The gain in gamma SNR was reduced in NRG1 (+/−) animals relative to WT controls (Mann–Whitney, U = 862, p < 0.0001). Error bars indicate SEM

References

    1. Agim ZS, et al. Discovery, validation and characterization of Erbb4 and Nrg1 haplotypes using data from three genome-wide association studies of schizophrenia. PLoS One. 2013;8:3. - PMC - PubMed
    1. Andersson RH, et al. Neuregulin and dopamine modulation of hippocampal gamma oscillations is dependent on dopamine D4 receptors. Proc Natl Acad Sci USA. 2012;109:13118–13123. - PMC - PubMed
    1. Arnfred SM. Proprioceptive information processing in schizophrenia. Dan Med J. 2012:59. - PubMed
    1. Arnfred SM, Hemmingsen RP, Parnas J. Delayed early proprioceptive information processing in schizophrenia. Br J Psychiatry. 2006;189:558–559. - PubMed
    1. Arnfred SM, Morup M, Thalbitzer J, Jansson L, Parnas J. Attenuation of beta and gamma oscillations in schizophrenia spectrum patients following hand posture perturbation. Psychiatry Res. 2011;185:215–224. - PubMed

Publication types

LinkOut - more resources