. 2015 Feb;138(Pt 2):356-70.
doi: 10.1093/brain/awu350. Epub 2014 Dec 16.

Predicting novel histopathological microlesions in human epileptic brain through transcriptional clustering

Affiliations

Predicting novel histopathological microlesions in human epileptic brain through transcriptional clustering

Fabien Dachet et al. Brain. 2015 Feb.

Abstract

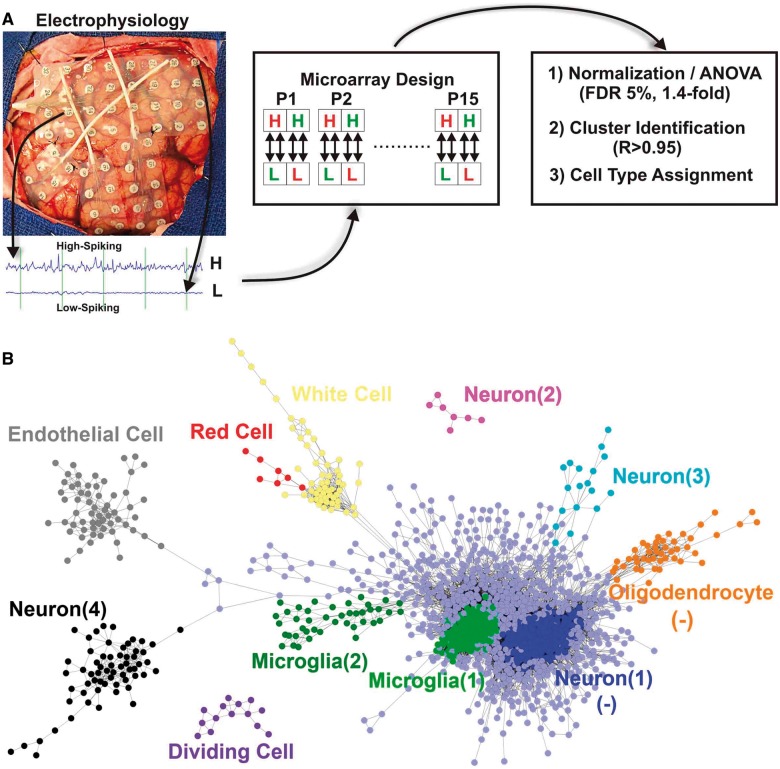
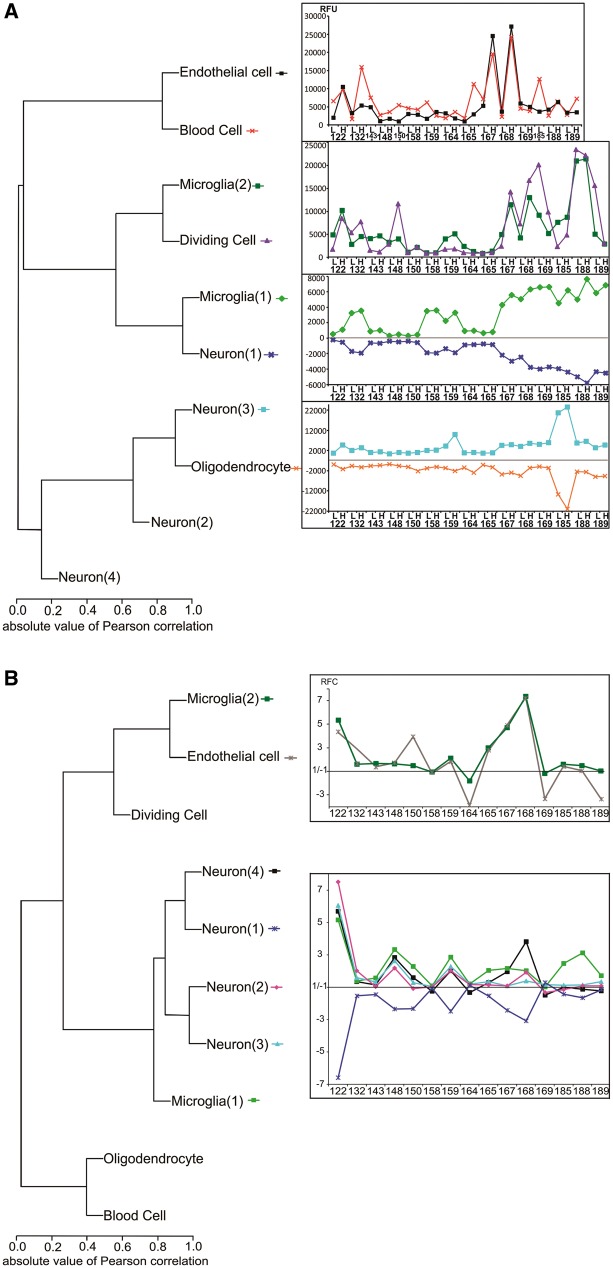
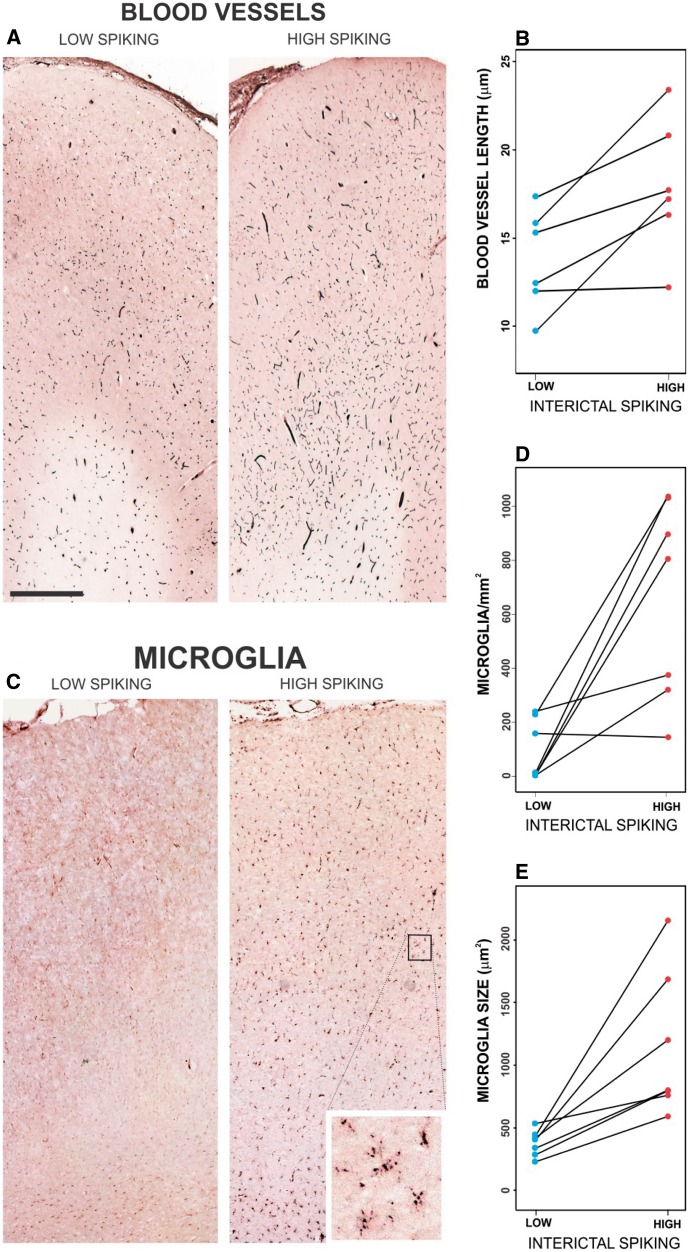
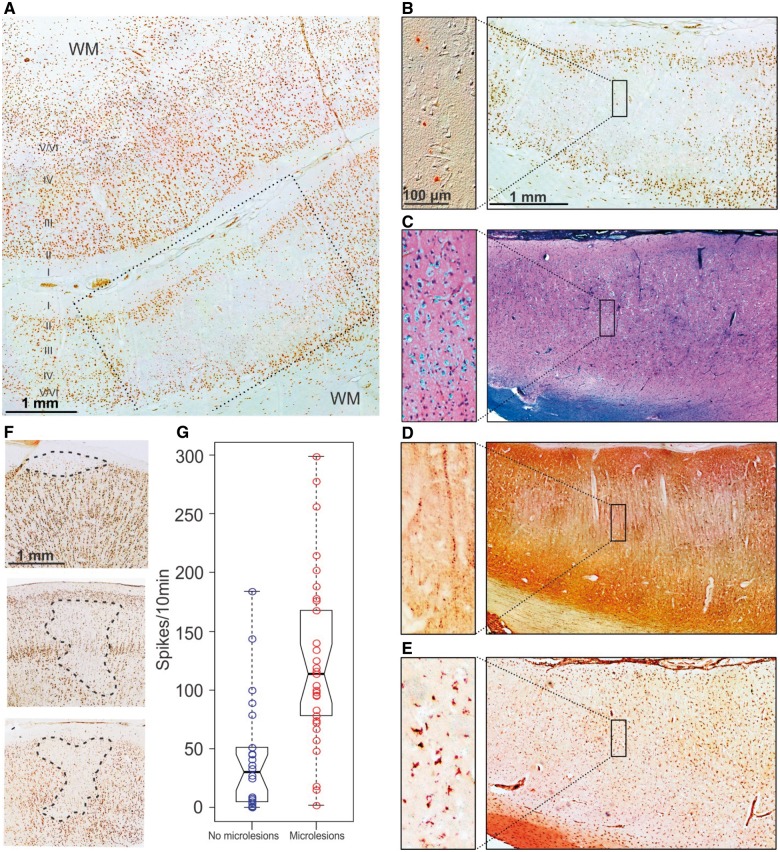
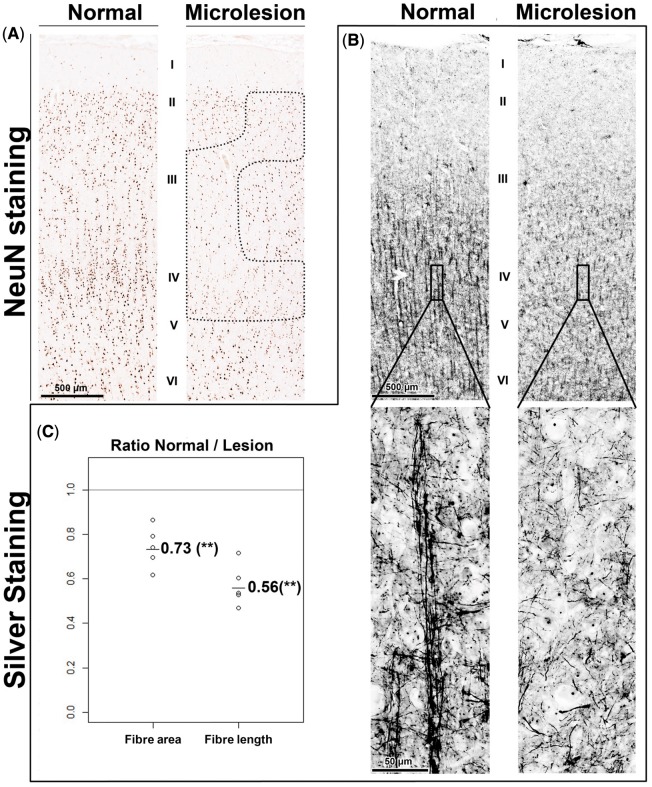
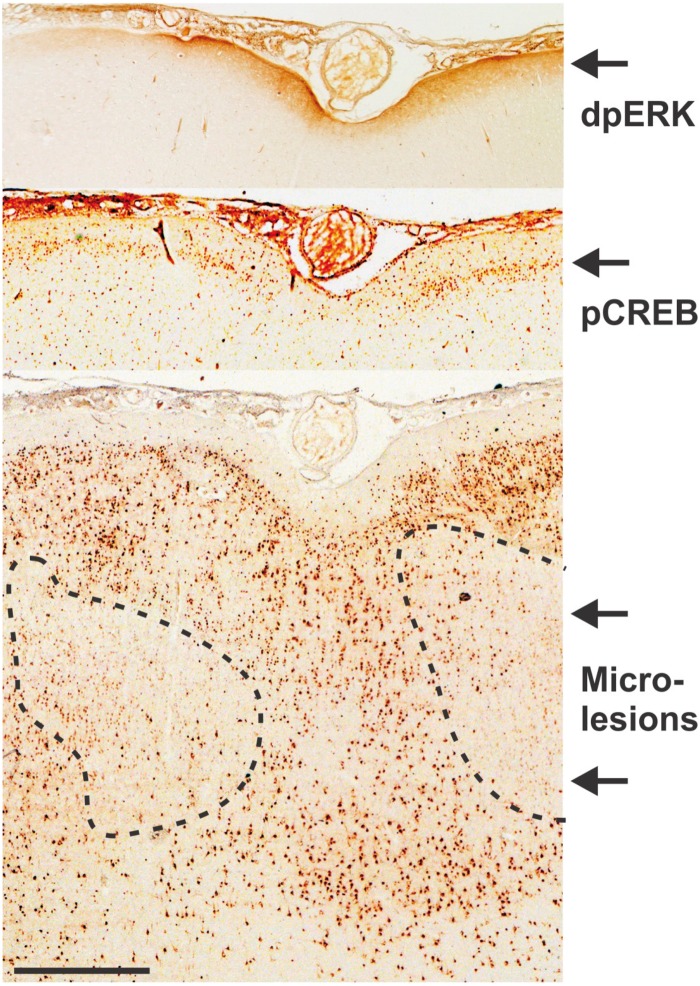
Although epilepsy is associated with a variety of abnormalities, exactly why some brain regions produce seizures and others do not is not known. We developed a method to identify cellular changes in human epileptic neocortex using transcriptional clustering. A paired analysis of high and low spiking tissues recorded in vivo from 15 patients predicted 11 cell-specific changes together with their 'cellular interactome'. These predictions were validated histologically revealing millimetre-sized 'microlesions' together with a global increase in vascularity and microglia. Microlesions were easily identified in deeper cortical layers using the neuronal marker NeuN, showed a marked reduction in neuronal processes, and were associated with nearby activation of MAPK/CREB signalling, a marker of epileptic activity, in superficial layers. Microlesions constitute a common, undiscovered layer-specific abnormality of neuronal connectivity in human neocortex that may be responsible for many 'non-lesional' forms of epilepsy. The transcriptional clustering approach used here could be applied more broadly to predict cellular differences in other brain and complex tissue disorders.

Keywords: epilepsy genetics; epilepsy surgery; localization-related epilepsy; refractory epilepsy; transcriptomics.


Figures

Figure 1
Figure 1
Paired analysis of low- and high-spiking human neocortex reveals a cellular interactome. (A) Subdural arrays of electrodes placed on the cortex of a human epileptic patient are used to detect low and high interictal spiking areas. Total RNA from each of these areas was used in a quadruplicate dye-swap microarray design to identify differentially expressed genes. (B) The expression of the differentially expressed genes across all patients was used to build a cellular interactome to predict changes in cellular composition in low- versus high-spiking human neocortex. Each cluster of genes represents a different cell type and is displayed with a different colour, where each dot represents a single RNA transcript. The links shown between each gene in a given cluster had a Pearson correlation coefficient ≥0.95. Clusters are themselves clustered based on how closely they are statistically linked to each other. (-) refers to cell clusters that are downregulated.
Figure 2
Figure 2
Hierarchical clustering of assigned cell types predicts both parallel and reciprocal patterns of cellular changes in high-spiking human neocortex. (A) Hierarchical clustering of the predicted cell clusters using Pearson correlations were used to generate their corresponding profile from the average expression of genes within a given cluster. Dendrograms showing similar as well as reciprocal correlations between each cell cluster across patient samples are shown. For each patient sample, ‘L’ indicates low-spiking and ‘H’ high-spiking brain regions. To account for the downregulation of type 1 neurons and oligodendrocytes the values in low-spiking and high-spiking were inverted on the y-axis. (B) Hierarchical clustering of normalized fluorescence ratios between high and low spiking cell clusters segregated into two groups: (i) clustering of neuron types 1, 2, 3 and 4 with type 1 microglia; and (ii) clustering of endothelial cells and type 2 microglia. RFU = relative fluorescence unit; RFC = relative fold change. *This cluster has been computed after removing three samples (high-spiking regions from Patients 143, 150 and 185) because they showed aberrant blood contamination from surgery.
Figure 3
Figure 3
Validation of increased vascularity and microglial infiltration in high-spiking human neocortex. (A) Staining blood vessels shows an increase in vascularity in high-spiking brain areas. (B) Blood vessel length was significantly increased in the high-spiking brain for seven patients (two-tailed, paired P-value < 0.05). (C–E) Microglia number and size were both increased in high-spiking areas versus low-spiking areas using CD68 staining across six patients (both two-tailed, paired P-value < 0.05). The scale bar in A indicates 1 mm.
Figure 4
Figure 4
Evidence for focal microlesions in high-spiking human neocortex. (A) NeuN staining revealed both normal (upper part of section) and regions with reduced NeuN staining (lower part). (B) Regions with decreased NeuN staining still had neurons shown by differential interference contrast microscopy (enlargement) and were centred in layers III and IV, with a normal appearance of layers II, V and VI. Scale bar = 1 mm; inset bar = 100 µm. (C) Traditional histological staining with Luxol Fast blue-PAS and haematoxylin staining shows a normal-appearing laminar pattern of neurons that would not have detected these lesions. (D) NeuN negative regions have markedly reduced staining of neuronal processes using MAP2 antibodies. (E) NeuN negative regions are full of microglia stained with CD68. (F) Three different types of microlesions were seen by NeuN staining involving layers II/III (9%), layers III and IV (34%), or layers II–IV (57%). (G) Microlesions were strongly associated with interictal spike frequency (unpaired t-test, P < 10−5). WM = white matter.
Figure 5
Figure 5
Silver staining confirms a marked loss of neuronal processes in microlesions. (A) Microlesions identified by NeuN staining show a marked reduction of silver-stained neuronal processes in layer IV (B). (C) Quantitation of fibre density and length from five patients showed a significant reduction of the average fibre density and length in the microlesions. **A paired P-value < 0.01.
Figure 6
Figure 6
Microlesions were strongly associated with activation of epileptic biomarkers in superficial brain layers. Regions of high interictal spiking showing microlesions with NeuN staining almost always showed nearby activation of epileptic biomarkers including diphosphoERK (dpERK) in layer I and phosphoCREB (pCREB) in layer II. The scale bar indicates 1 mm.

References

    1. Annegers J. Philadelphia, PA: Lea & Febiger; 1993. The treatment of epilepsy: principles and practices.
    1. Aronica E, Gorter JA, Redeker S, Ramkema M, Spliet WG, van Rijen PC, et al. Distribution, characterization and clinical significance of microglia in glioneuronal tumours from patients with chronic intractable epilepsy. Neuropathol Appl Neurobiol. 2005;31:280–91. - PubMed
    1. Asano E, Muzik O, Shah A, Juhasz C, Chugani DC, Sood S, et al. Quantitative interictal subdural EEG analyses in children with neocortical epilepsy. Epilepsia. 2003;44:425–34. - PubMed
    1. Barkmeier DT, Senador D, Leclercq K, Pai D, Hua J, Boutros NN, et al. Electrical, molecular and behavioral effects of interictal spiking in the rat. Neurobiol Dis. 2012a;47:92–101. - PMC - PubMed
    1. Barkmeier DT, Shah AK, Flanagan D, Atkinson MD, Agarwal R, Fuerst DR, et al. High inter-reviewer variability of spike detection on intracranial EEG addressed by an automated multi-channel algorithm. Clin Neurophysiol. 2012b;123:1088–95. - PMC - PubMed

Publication types