. 2015 Feb;3(2):116-24.
doi: 10.1158/2326-6066.CIR-14-0159. Epub 2014 Dec 16.

Checkpoint blockade immunotherapy relies on T-bet but not Eomes to induce effector function in tumor-infiltrating CD8+ T cells

Affiliations

Checkpoint blockade immunotherapy relies on T-bet but not Eomes to induce effector function in tumor-infiltrating CD8+ T cells

Melissa M Berrien-Elliott et al. Cancer Immunol Res. 2015 Feb.

Abstract

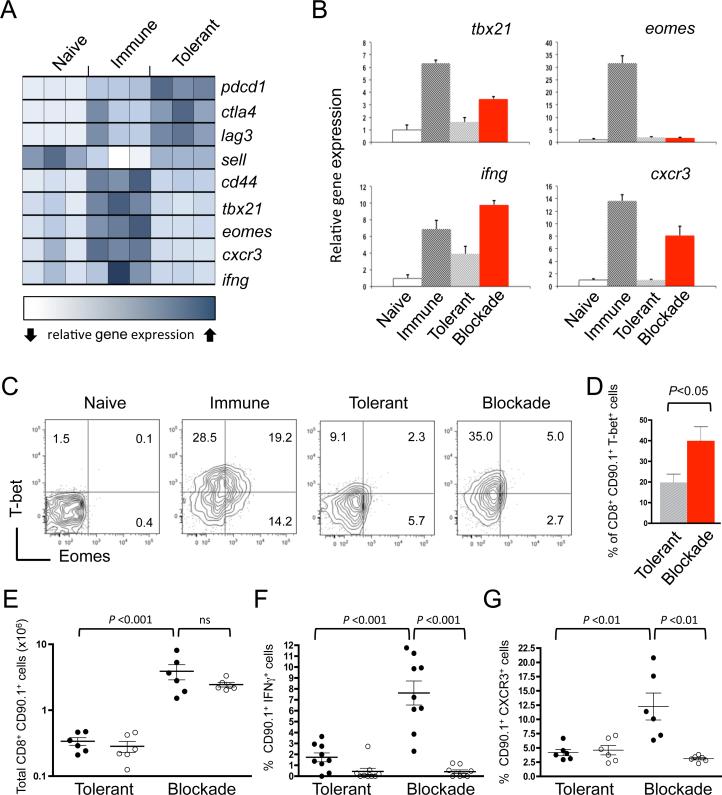
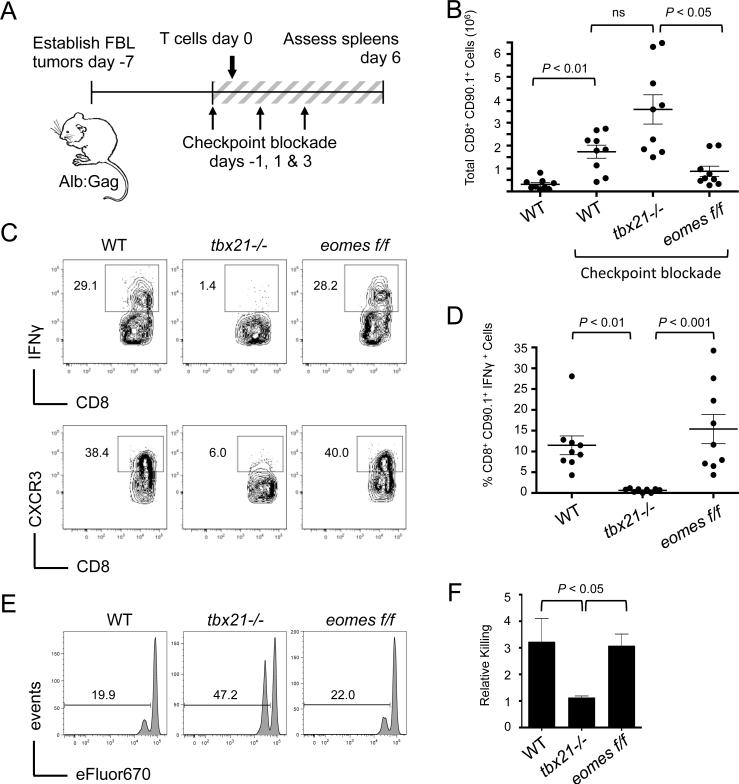
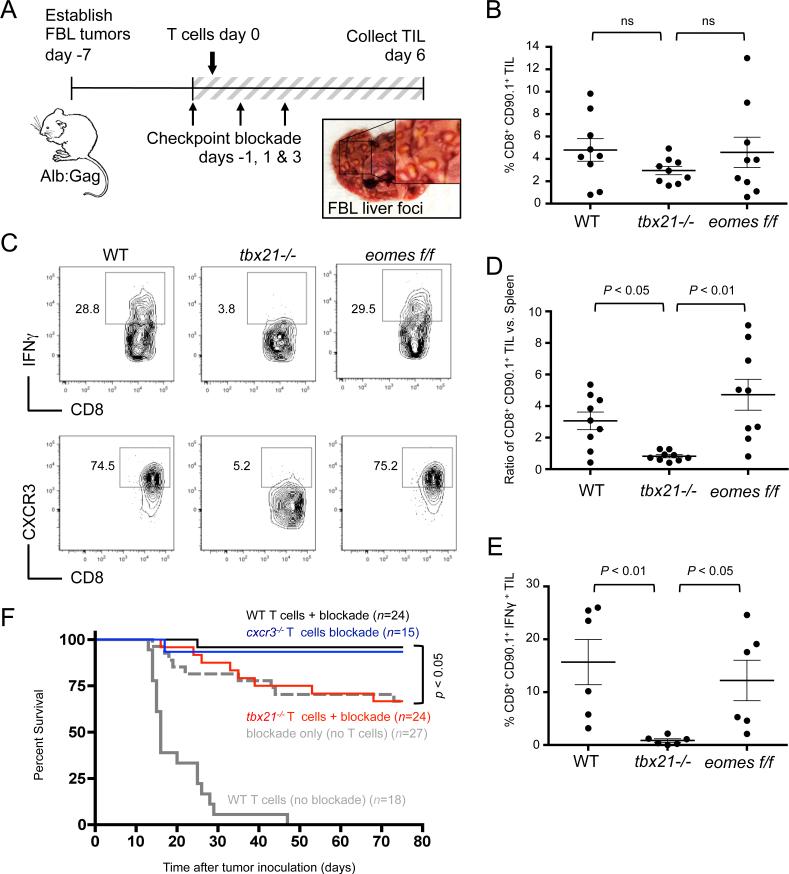
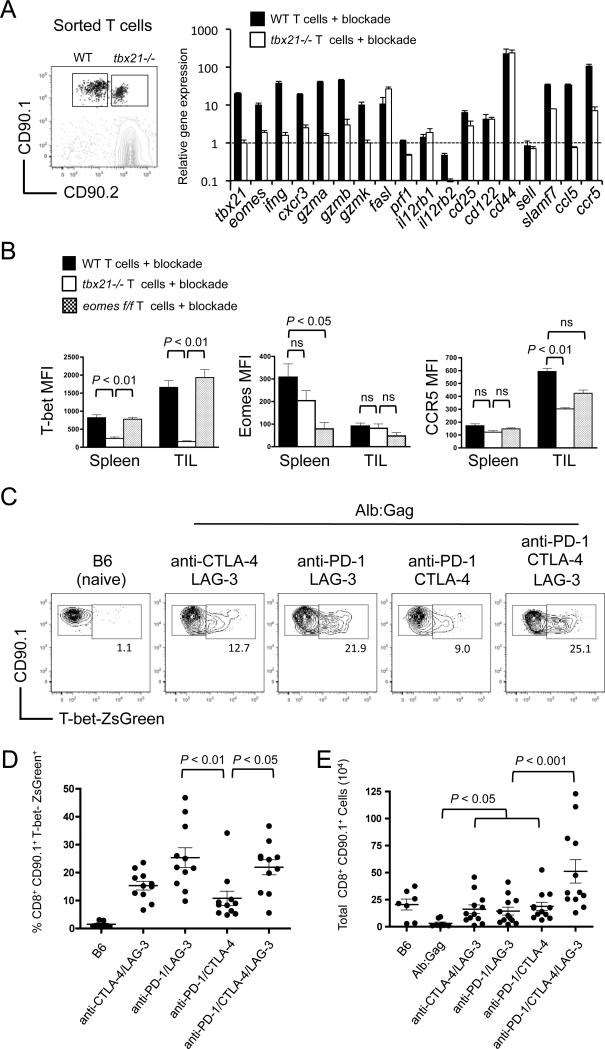
Coinhibitory receptor blockade is a promising strategy to boost T-cell immunity against a variety of human cancers. However, many patients still do not benefit from this treatment, and responders often experience immune-related toxicities. These issues highlight the need for advanced mechanistic understanding to improve patient outcomes and uncover clinically relevant biomarkers of treatment efficacy. However, the T-cell-intrinsic signaling pathways engaged during checkpoint blockade treatment are not well defined, particularly for combination approaches. Using a murine model to study how effector CD8(+) T-cell responses to tumors may be enhanced in a tolerizing environment, we identified a critical role for the T-box transcription factor T-bet. Combination blockade of CTLA-4, PD-1, and LAG-3 induced T-bet expression in responding tumor/self-reactive CD8(+) T cells. Eradication of established leukemia using this immunotherapy regimen depended on T-bet induction, which was required for IFNγ production and cytotoxicity by tumor-infiltrating T cells, and for efficient trafficking to disseminated tumor sites. These data provide new insight into the success of checkpoint blockade for cancer immunotherapy, revealing T-bet as a key transcriptional regulator of tumor-reactive CD8(+) T-cell effector differentiation under otherwise tolerizing conditions.


Figures

Figure 1
Figure 1. T-bet is induced by combination checkpoint blockade
Naive Gag-specific CD8+ T cells (CD90.1+) were transferred into B6 mice bearing an immunogenic FBL tumor (immune), Alb:Gag mice (tolerant), or Alb:Gag mice treated with checkpoint blockade antibodies (blockade). (A) Two days after transfer, T cells were FACS purified and RNA isolated for gene expression analysis by microarray. Each square represents one biological triplicate for each experimental condition. (B) Transferred CD8+ T cells from the indicated environments were FACS purified after 3 days in vivo, and relative gene expression assessed by qRT-PCR normalized to actin. Error bars depict SD. (C) T-bet and Eomes intracellular protein expression was determined in Gag-reactive T cells 3 days after transfer into the indicated recipients. Quadrants were set based on T-bet and Eomes expression in naive T cells from B6 mice (left). Inset numbers within contour plots are the percent of CD90.1+ CD8+ cells in the quadrant fields. (D) Pooled data from 3 independent experiments showing the frequency of T-bet+ CD8+ T cells in recipient spleens 3 days after transfer. (E) Naive WT (●) or tbx21−/− (○) T cells were transferred into the tolerant or blockade environment and the total number of transferred T cells (CD8+ CD90.1+) in spleens was determined 4 days after infusion. Graph shows pooled data from 2 separate experiments. (F) Splenocytes were stimulated overnight and the frequency of CD8+ CD90.1+ T cells producing IFNγ was determined by intracellular flow cytometry; graphs are pooled from 3 experiments. (G) The percent of CD8+ CD90.1+ T cells expressing CXCR3 is graphed from 2 pooled experiments. Each circle represents individual recipient mice, horizontal lines depict the mean, and error bars indicate SEM, unless otherwise noted. P-values are indicated for the bracketed groups (ns=not significant).
Figure 2
Figure 2. T-bet is required for blockade-mediated T-cell effector function
FBL tumor-bearing Alb:Gag mice were infused with of WT, tbx21−/−, or eomesf/f Gag-reactive CD8+ T cells and treated on days −1, 1 and 3 with combination checkpoint blockade. (A) Diagram of experimental setup. (B) Six days after T-cell infusion, the total number of transferred CD90.1+ CD8+ T cells in recipient spleens was assessed. Data are pooled from 3 independent experiments. (C) IFNγ production by transferred T cells was assessed after overnight restimulation with Gag peptide. Expression of CXCR3 on transferred T cells was determined directly ex vivo. Inset numbers represent the percent of CD90.1+ CD8+ cells within the designated region. (D) The frequency of IFNγ-producing CD90.1+ CD8+ T cells from 3 individual experiments is shown graphically. Circles represent individual recipients and horizontal lines show the mean of each group with p-values indicated for the bracketed groups. (E) Five days after T-cell transfer, recipients were infused with a 1:1 ratio of Gag (eFluorlow) and control (eFluorhigh) peptide-pulsed target cells. Target-cell frequency in spleens was assessed one day later, with representative histograms shown. Inset numbers are the percent of total target cells under the indicated region. (F) The ratio of eFluorlow to eFluorhigh target cells is graphically displayed from 2 pooled experiments (n=6 for each group). Error bars depict the SEM and p-values are indicated for the bracketed groups.
Figure 3
Figure 3. T-bet is required for TIL effector function and immunotherapy but not for tumor infiltration
FBL tumor-bearing Alb:Gag mice were infused with of WT, tbx21−/−, or eomesf/f Gag-reactive CD8+ T cells and treated on days −1, 1 and 3 with combination checkpoint blockade. (A) Diagram of experimental setup for panels B-E, and example of tumor foci (inset box) on a representative liver at day 6. (B) The frequency of transferred CD90.1+ CD8+ T cells among all TILs was assessed 6 days after T-cell infusion, and data pooled from 3 separate experiments and displayed graphically. (C) IFNγ production by transferred T cells after overnight restimulation with Gag peptide and CXCR3 surface expression directly ex vivo were assessed. (D) The ratio of CD90.1+ CD8+ T-cell frequency in TILs versus in spleens from the same recipients in Fig. 2B is shown. (E) Pooled data from 3 individual experiments showing the frequency of CD90.1+ CD8+ TILs producing IFNγ. Circles within all graphs represent individual recipient mice and horizontal lines show the mean of each group with p-values indicated for the bracketed groups; all error bars represent SEM. (F) Survival of tumor-bearing Alb:Gag recipients was assessed following treatment with WT T cells only (gray line), checkpoint blockade (anti-CTLA-4/PD-1/LAG-3) only (dashed gray line), or checkpoint blockade and adoptive transfer of WT T cells (black line), cxcr3−/− T cells (blue) or tbx21−/− T cells (red). The graph displays pooled data from 5 independent experiments, showing percent survival (y-axis) over time in days (x-axis). The n-values depict the number of total mice per treatment group and the p-value is indicated for the bracketed groups.
Figure 4
Figure 4. T-bet regulates expression of T-cell effector genes
FBL tumor-bearing Alb:Gag mice received a co-transfer of WT (CD90.1) and tbx21−/− (CD90.1/CD90.2) Gag-reactive CD8+ T cells and were treated with combination checkpoint blockade on days −1, 1 and 3. (A) Six days after T-cell infusion, transferred T cells were isolated from the spleen and RNA isolated for analysis by qRT-PCR. Expression of the indicated genes from WT (closed bars) and tbx21−/− (open bars) T cells is shown relative to the level of the same gene expressed in naive Gag-reactive CD8+ T cells, which was arbitrarily set at a value of 1 and indicated by the dashed horizontal line. Results are representative of 2 independent experiments, and error bars represent SD among triplicate samples. (B) MFI of T-bet, Eomes, and CCR5 from WT (closed bars), tbx21−/− (open bars) and eomesf/f (shaded bars) Gag-reactive CD8+ T cells from spleens and TILs 6 days after infusion into FBL tumor-bearing Alb:Gag mice treated with checkpoint blockade. Graphs displays data from 2 pooled experiments and error bars indicate SEM with p-values indicated for the bracketed groups. (C) B6 or FBL tumor-bearing Alb:Gag mice were infused with T-bet-ZsGreen Gag-reactive CD8+ T cells and treated with checkpoint blockade antibodies on days −1, 1, and 3. Representative FACS plots display T-bet-ZsGreen expression on splenic CD8+ CD90.1+ cells 6 days after transfer. Inset numbers are the frequency of cells within the above region. (D) Pooled data from 4 independent experiments shows the frequency of CD8+ CD90.1+ T-bet-ZsGreen+ cells from indicated recipient mice. (E) Total CD8+ CD90.1+ T-bet-ZsGreen+ cell numbers pooled from 4 separate experiments are displayed graphically. Each circle represents an individual mouse and p-values are indicated for the bracketed groups.

References

    1. Fridman WH, Pages F, Sautes-Fridman C, Galon J. The immune contexture in human tumours: impact on clinical outcome. Nat Rev Cancer. 2012;12:298–306. - PubMed
    1. Schreiber RD, Old LJ, Smyth MJ. Cancer immunoediting: integrating immunity's roles in cancer suppression and promotion. Science. 2011;331:1565–70. - PubMed
    1. Teague RM, Kline J. Immune evasion in acute myeloid leukemia: current concepts and future directions. J Immunother Cancer. 2013;1:13. - PMC - PubMed
    1. Tivol EA, Borriello F, Schweitzer AN, Lynch WP, Bluestone JA, Sharpe AH. Loss of CTLA-4 leads to massive lymphoproliferation and fatal multiorgan tissue destruction, revealing a critical negative regulatory role of CTLA-4. Immunity. 1995;3:541–7. - PubMed
    1. Freeman GJ, Long AJ, Iwai Y, Bourque K, Chernova T, Nishimura H, et al. Engagement of the PD-1 immunoinhibitory receptor by a novel B7 family member leads to negative regulation of lymphocyte activation. J Exp Med. 2000;192:1027–34. - PMC - PubMed

Publication types

MeSH terms