Comparative Study
. 2015 Feb 1;308(3):E206-22.
doi: 10.1152/ajpendo.00406.2014. Epub 2014 Dec 16.

Comparison of the physiological relevance of systemic vs. portal insulin delivery to evaluate whole body glucose flux during an insulin clamp

Affiliations
Comparative Study

Comparison of the physiological relevance of systemic vs. portal insulin delivery to evaluate whole body glucose flux during an insulin clamp

Tiffany D Farmer et al. Am J Physiol Endocrinol Metab. .

Abstract

To understand the underlying pathology of metabolic diseases, such as diabetes, an accurate determination of whole body glucose flux needs to be made by a method that maintains key physiological features. One such feature is a positive differential in insulin concentration between the portal venous and systemic arterial circulation (P/S-IG). P/S-IG during the determination of the relative contribution of liver and extra-liver tissues/organs to whole body glucose flux during an insulin clamp with either systemic (SID) or portal (PID) insulin delivery was examined with insulin infusion rates of 1, 2, and 5 mU·kg(-1)·min(-1) under either euglycemic or hyperglycemic conditions in 6-h-fasted conscious normal rats. A P/S-IG was initially determined with endogenous insulin secretion to exist with a value of 2.07. During an insulin clamp, while inhibiting endogenous insulin secretion by somatostatin, P/S-IG remained at 2.2 with PID, whereas, P/S-IG disappeared completely with SID, which exhibited higher arterial and lower portal insulin levels compared with PID. Consequently, glucose disappearance rates and muscle glycogen synthetic rates were higher, but suppression of endogenous glucose production and liver glycogen synthetic rates were lower with SID compared with PID. When the insulin clamp was performed with SID at 2 and 5 mU·kg(-1)·min(-1) without managing endogenous insulin secretion under euglycemic but not hyperglycemic conditions, endogenous insulin secretion was completely suppressed with SID, and the P/S-IG disappeared. Thus, compared with PID, an insulin clamp with SID underestimates the contribution of liver in response to insulin to whole body glucose flux.

Keywords: insulin clamp method; liver; muscle; portal-systemic insulin gradient.


Figures

Fig. 1.
Fig. 1.
Plasma concentration of insulin (A) and glucagon (C) in the artery and portal vein and portal-to-arterial ratio of plasma concentration of these hormones (B and D) before and during somatostatin infusion in 6-h-fasted conscious rats. Data are means ± SE for 6 experiments.
Fig. 2.
Fig. 2.
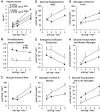
Plasma insulin levels in the artery and portal vein (A), and portal-to-arterial ratio of plasma insulin concentration (B), rates of glucose infusion (C), glucose disappearance (D), endogenous glucose production (E), glycogen content in muscle (F) and liver (G), and glycogen synthesis from plasma glucose via the direct pathway in muscle (H) and liver (I) in relation to insulin infusion rates during plasma insulin clamps with portal (PID) and systemic (SID) insulin delivery under euglycemic conditions in 6-h-fasted conscious rats. Data are means ± SE of the average of the values at 3 time points (60, 120, and 180 min) for insulin and 5 time points (60, 90, 120, 150, and 180 min) for glucose flux during the clamp period and mean ± SE for the values at the end of the test period for glycogen content for 6 experiments. *Significantly different from the corresponding values of the portal insulin infusion group (P < 0.05).
Fig. 3.
Fig. 3.
Plasma insulin levels in the artery and portal vein (A), portal-to-arterial ratio of plasma insulin concentration (B), rates of glucose infusion (C), glucose disappearance (D), endogenous glucose production (E), glycogen content in muscle (F) and liver (G), and glycogen synthesis from plasma glucose via the direct pathway in muscle (H) and liver (I) in relation to insulin infusion rates during plasma insulin clamps with PID and SID insulin delivery under hyperglycemic conditions in 6-h-fasted conscious rats. Data are means ± SE of the average of the values at 3 time points (60, 120, and 180 min) for insulin and 5 time points (60, 90, 120, 150, and 180 min) for glucose flux during the clamp period and mean ± SE for the values at the end of the clamp period for glycogen content for 6 experiments. *Significantly different from the corresponding values of the portal insulin infusion group (P < 0.05).
Fig. 4.
Fig. 4.
Portal-arterial gradient of plasma insulin during insulin clamps with either portal or systemic insulin delivery at 1, 2, and 5 mU·kg−1·min−1 in 6-h-fasted conscious rats. Each symbol represents the value before the insulin clamp (0 min) or the average of the values at 3 time points (60, 120, and 180 min) during the clamp period in each study with either the portal (PID) or the systemic (SID) insulin delivery.
Fig. 5.
Fig. 5.
Glucose disappearance rates (A and B), endogenous glucose production rates (C and D), and glucose incorporation rates into muscle (E and F) and liver (G and H) glycogen related to arterial (A, C, E, and G) and portal (B, D, F, and H) insulin levels during plasma insulin clamps with portal (PID) or systemic (SID) insulin delivery under euglycemic and hyperglycemic conditions in 6-h-fasted conscious rats. Data are means ± SE of the average of the values at 5 time points (60, 90, 120, 150, and 180 min) during the clamp period for 6 experiments.
Fig. 6.
Fig. 6.
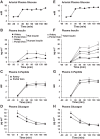
Arterial plasma glucose levels (A and E), and plasma levels of total, rat, and human recombinant insulin (B and F), C-peptide (C and G), and glucagon (D and H) in the artery and portal vein before and during hyperinsulinemic clamps with systemic infusion of human recombinant insulin at 2 (A, B, C, and D) and 5 (E, F, G, and H) mU·kg−1·min−1 in 6-h-fasted conscious rats. Plasma glucose levels were maintained at basal by systemic glucose infusion, if necessary. Data are means ± SE for 6 experiments.
Fig. 7.
Fig. 7.
Arterial plasma glucose levels (A and E) and plasma levels of total, rat, and human recombinant insulin (B and F), C-peptide (C and G), and glucagon (D and H) in the artery and portal vein before and during hyperglycemic clamp with and without peripheral infusion of human recombinant insulin at 5 mU·kg−1·min−1 in 6-h-fasted conscious rats. Data are means ± SE for 6 experiments.

References

    1. Ayala JE, Bracy DP, McGuinness OP, Wasserman DH. Considerations in the design of hyperinsulinemic-euglycemic clamps in the conscious mouse. Diabetes 55: 390–397, 2006. - PubMed
    1. Ayesha I, Bala TS, Reddy CV, Raghuramulu N. Vitamin D deficiency reduces insulin secretion and turnover in rats. Diabetes Nutr Metab 14: 78–84, 2001. - PubMed
    1. Balage M, Grizard J. Relationship between plasma glucagon disappearance and tissue uptake in rats. Reprod Nutr Dev 26: 31–38, 1986. - PubMed
    1. Bansal P, Wang Q. Insulin as a physiological modulator of glucagon secretion. Am J Physiol Endocrinol Metab 295: E751–E761, 2008. - PubMed
    1. Berglund ED, Vianna CR, Donato J Jr, Kim MH, Chuang JC, Lee CE, Lauzon DA, Lin P, Brule LJ, Scott MM, Coppari R, Elmquist JK. Direct leptin action on POMC neurons regulates glucose homeostasis and hepatic insulin sensitivity in mice. J Clin Invest 122: 1000–1009, 2012. - PMC - PubMed

Publication types