. 2015 Feb 13;290(7):3875-92.
doi: 10.1074/jbc.M114.622498. Epub 2014 Dec 16.

Single molecule analysis of functionally asymmetric G protein-coupled receptor (GPCR) oligomers reveals diverse spatial and structural assemblies

Affiliations

Single molecule analysis of functionally asymmetric G protein-coupled receptor (GPCR) oligomers reveals diverse spatial and structural assemblies

Kim C Jonas et al. J Biol Chem. .

Abstract

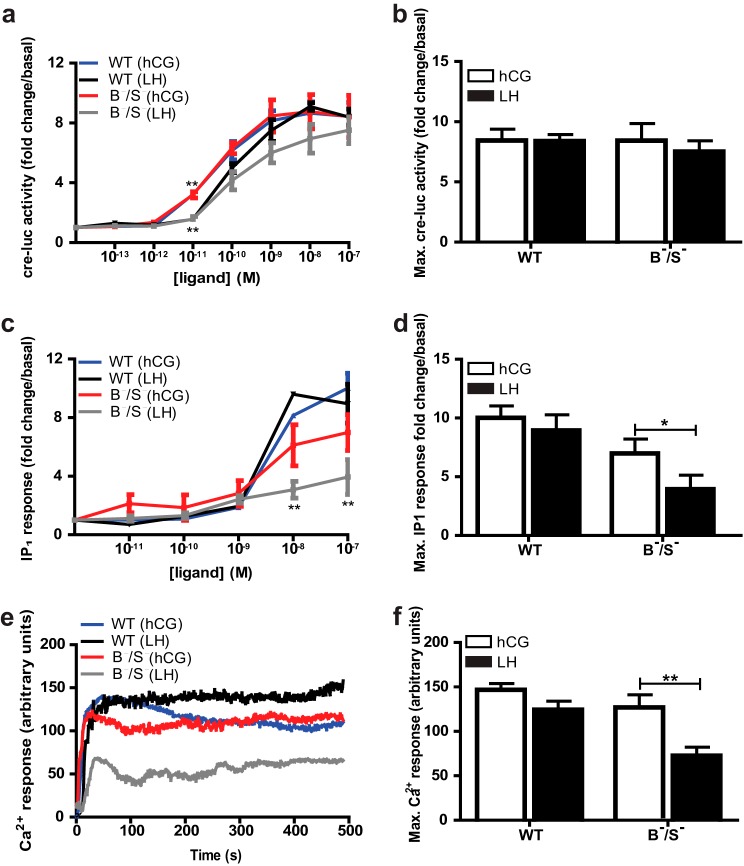
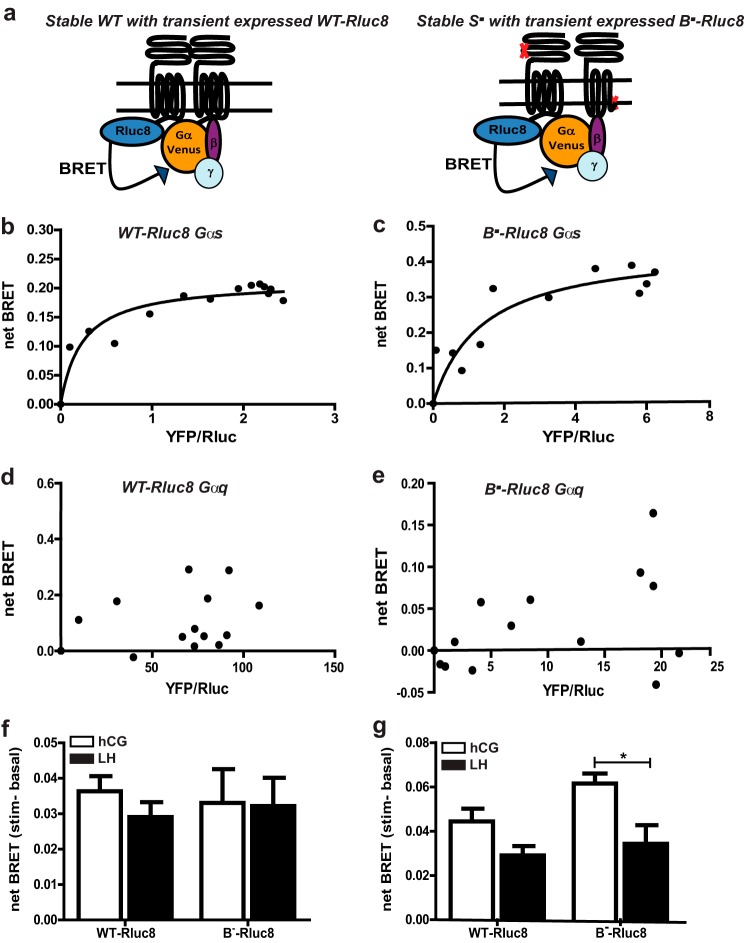
Formation of G protein-coupled receptors (GPCRs) into dimers and higher order oligomers represents a key mechanism in pleiotropic signaling, yet how individual protomers function within oligomers remains poorly understood. We present a super-resolution imaging approach, resolving single GPCR molecules to ∼ 8 nm resolution in functional asymmetric dimers and oligomers using dual-color photoactivatable dyes and localization microscopy (PD-PALM). PD-PALM of two functionally defined mutant luteinizing hormone receptors (LHRs), a ligand-binding deficient receptor (LHR(B-)) and a signaling-deficient (LHR(S-)) receptor, which only function via intermolecular cooperation, favored oligomeric over dimeric formation. PD-PALM imaging of trimers and tetramers revealed specific spatial organizations of individual protomers in complexes where the ratiometric composition of LHR(B-) to LHR(S-) modulated ligand-induced signal sensitivity. Structural modeling of asymmetric LHR oligomers strongly aligned with PD-PALM-imaged spatial arrangements, identifying multiple possible helix interfaces mediating inter-protomer associations. Our findings reveal that diverse spatial and structural assemblies mediating GPCR oligomerization may acutely fine-tune the cellular signaling profile.

Keywords: Bioluminescence Resonance Energy Transfer (BRET); Cell Signaling; Dimer; G Protein; G protein-Coupled Receptor (GPCR); Oligomer; Structural Biology; Super-resolution Imaging.


Figures

FIGURE 1.
FIGURE 1.
Visualization of single WT LHR molecules within dimers and oligomers using PD-PALM. a, principles of PD-PALM, utilizing simultaneous dual-color imaging of CAGE 500- and 552-labeled receptors. CAGE 500 and 552 dyes were stochastically “uncaged” by UV, excited, and photo-bleached using 491- and 561-nm lasers, respectively, through multiple cycles until all fluorophores were activated and bleached. b, representative reconstructed PD-PALM of the basal landscape of WT LHR stably expressed in HEK 293 cells. Images are 2 μm2 from a 7-μm2 area. Scale bars, 500 nm. Reconstructed data sets were subjected to localization identification using QuickPALM followed by neighborhood analysis, using a 50-nm search radius. A color-coded representative heat map of the number of associated molecules from the respective reconstructed images is depicted. c, diagram showing the principle of Getis and Franklin neighborhood analysis. If a receptor (labeled 1, search distance yellow circle) was detected within a 50-nm radius of another receptor (labeled 2), then the analysis continued to recursively search for other receptors within a 50-nm radius of the next identified associating receptor (orange circles, labeled 3, 4, 5), until no further associating receptors were detected (purple circles). The receptors in this diagram would be identified as a pentamer and two monomers. d, percentage of WT LHR dimers, trimers, and tetramers at varying search radii. e, comparison of percentage of total associated molecules in cell lines stably expressing WT LHR versus randomly generated simulated data sets containing the same density of molecules. f, relative proportions of dimeric and higher order oligomeric associated WT LHR. g, comparison of WT homomeric, M-CSF receptor homomeric, and WT/M-CSF heteromeric receptor populations following single or co-expression of WT LHR and M-CSF receptor. All data points represent the mean ± S.E. of 10–12 individual cells, n = 3. d was analyzed by Student's t test; f by one-way ANOVA with Dunnett's post hoc test; and g, by two-way ANOVA with Bonferroni's pairwise comparison post hoc test. ***, p < 0.001.
FIGURE 2.
FIGURE 2.
Visualization of LHRB−/LHRS− dimers and oligomers using PD-PALM. a, representative reconstructed PD-PALM images in 491- and 561-nm channels of singly expressed LHRB− (B), LHRS− (S), and co-expressing LHRB−/LHRS− (B/S) stable cell lines. Images are 2 μm2 from a 7-μm2 area. Scale bars, 500 nm. Reconstructed data sets were subjected to localization identification using QuickPALM followed by neighborhood analysis, using a 50-nm search radius. A color-coded representative heat map of the number of associated molecules from the respective reconstructed images is depicted. b, percentage of LHRB−/LHRS− dimers, trimers, and tetramers at varying search radius used for the nearest neighborhood analysis. Each data point represents the mean ± S.E. of three independent experiments. c, comparison of the total number of associated molecules observed in cell lines co-expressing LHRB−/LHRS− and randomly generated simulated data sets containing the same range of molecule densities. d, comparison of the total number of WT-, LHRB−-, and LHRS−-associating molecules in cell lines singly expressing these receptor subtypes. e, relative proportions of dimeric and higher order oligomeric associated WT, LHRB−, and LHRS− from the total number of associated receptors in d. f, comparison of the percentage of total associated heteromeric LHRB−/LHRS−, homomeric LHRB−, and LHRS− in cell lines stably expressing LHRB−/LHRS−. g, relative proportions of LHRB−/LHRS− heteromers, and LHRB− and LHRS− homomers within the LHRB−/LHRS−-expressing cell line from f. *, p < 0.05; **, p < 0.01; ***, p < 0.001.
FIGURE 3.
FIGURE 3.
Intermolecular cooperation of LHR is sufficient to fully activate hCG but not LH-mediated G protein signaling. a, HEK 293 cells stably expressing WT LHR (WT) or LHRB−/LHRS− (B/S) transiently transfected with cre-luc reporter gene and Renilla luciferase (normalization control) and treated with hCG or LH (10−13–10−7 m) for 4 h. b, maximum cre-luc responses to hCG and LH in WT and LHRB−/LHRS− cell lines from a. c, total IP1 measured in cells stably expressing WT LHR or LHRB−/LHRS− following stimulation with either hCG or LH (10−12–10−7 m) for 60 min. d, maximum IP1 responses to hCG or LH in WT and LHRB−/LHRS− (c). Concentration responses (a and c) were normalized to individual basal responses and expressed as fold change/basal, each data point represents mean ± S.E., n = 3. e, representative Ca2+ fluorescent intensity plots (arbitrary units) from real time confocal imaging with Ca2+ dye, Fluo-4 Direct, following stimulation with LH or hCG (100 nm). Responses were obtained from 10 individual cells, n = 5. f, maximum Ca2+ responses from e following treatment with LH or hCG.
FIGURE 4.
FIGURE 4.
Constitutive and ligand-induced BRET between WT LHR or LHRB with either Gαq or Gαs proteins. a, schematic showing the experimental design of receptor-G protein associations. Gα proteins were Venus-tagged, and β and γ subunits were untagged. Representative BRET saturation curves were used to measure constitutive association of WT-Rluc8 with Gαs (b), LHRB−Rluc8 with Gαs (c), WT-Rluc8 with Gαq (d), or LHRB−Rluc8 with Gαq (e). Data are representative of at least three independent experiments, conducted in duplicate. Cells stably expressing WT LHR or LHRS− were transiently transfected with Venus-tagged Gαs (f) or Gαq (g) and either LHR WT-Rluc8 (in cell lines stably expressing WT) or LHRB−Rluc8 (in cell lines stably expressing LHRS−). Basal BRET was obtained for 1 min prior to LH or hCG (100 nm) addition for 1 min. f and g represents mean ± S.E. of 6–11 independent experiments conducted in triplicate. *, p < 0.05.
FIGURE 5.
FIGURE 5.
Organization of WT LHR and LHRB−/LHRS− complexes following ligand treatment. Cells stably expressing either WT LHR or LHRB−/LHRS− were treated with hCG and LH (both 10 nm) following 30 s (a and b), 2 min (c and d), or 5 min (e and f). Samples were imaged via PD-PALM, and relative proportions of dimeric and higher order oligomeric associated receptors were quantitated as in Fig. 1. Each data point represents the mean ± S.E. of 8–12 individual cells from three independent experiments. A two-way ANOVA with Bonferroni's post hoc test was conducted.
FIGURE 6.
FIGURE 6.
Ratiometric molecular composition of LHRB− to LHRS− impacts signal sensitivity and oligomeric composition. Comparison of hCG-dependent cre-luc activity (a) and IP1 accumulation (b) in cells stably expressing LHRB−/LHRS− at differing cell surface densities, as determined by flow cytometry and depicted as mean fluorescence. Open circle and square depict relative values for WT LHR (WT) and LHRB−/LHRS− (B/S) cell lines, respectively, used for all ligand-induced signaling and PD-PALM experiments. The red square depicts a cell line stably expressing WT at equivalent expression levels and relative cre-luc and IP1 functional activities. A Pearson's correlation of the cell lines expressing LHRB−/LHRS− at similar overall surface levels (highlighted black box, filled circles) was carried out comparing cre-luc activity (c) and IP1 accumulation (d) to the cell surface ratio of LHRB−/LHRS− as determined by flow cytometry analysis. Each data point represents the mean ± S.E. of three independent experiments, completed in triplicate. e–g, analysis of basal PALM datasets to determine how the ratio of LHRS−/LHRB− within an individual cell impacts on the molecular ratiometric composition of trimeric (e) and tetrameric (f) complexes. g, effect of the ratiometric composition of LHRB−/LHRS− on the percentage of LHRS− monomers in cells with excess LHRS−/LHRB−, a 1:1 ratio or an excess LHRB−/LHRS−. Each data point in e–g represents a 7-μm2 area from an individual cell, for a total of eight cells from four independent experiments. Data in e and f were subjected to a two-way ANOVA with Bonferroni's multiple comparison post hoc test; g, one-way ANOVA with Bonferroni's pairwise comparison post hoc test. *, p < 0.05; ***, p < 0.001.
FIGURE 7.
FIGURE 7.
PD-PALM imaging and structural modeling of functionally asymmetric trimeric complexes. a, representative PD-PALM images showing spatial arrangements of LHRB− (yellow) and LHRS− (blue); scale bars are 50 nm. 50 PD-PALM identified trimers were used for comparison of spatial arrangements with computationally derived structural data (see “Experimental Procedures” for further information). b, structural models of predicted heterotrimers (B/S). Structural modeling of heterotrimer architectures that closely aligned with PD-PALM images in a. The structures are depicted from the extracellular side in a direction perpendicular to the membrane surface. Yellow and blue spheres are centered on the Cα-atom of the first N-terminal amino acid, and yellow and blue colors indicate LHRB− and LHRS−, respectively. Roman numerals in a and b indicate matched complexes. The inset images are color-inverted images (from black to white) of respective PD-PALM image as listed in a and enlarged to double the size of the original PD-PALM images shown in a.
FIGURE 8.
FIGURE 8.
PD-PALM imaging and structural modeling of functionally asymmetric tetrameric complexes. a, representative PD-PALM images showing spatial arrangements of LHRB− and LHRS−. Scale bars, 50 nm. 50 PD-PALM imaged tetramers were selected and used for comparison of spatial arrangements with structural data (see “Experimental Procedures” for further details). b, structural models of the predicted heterotetramers (B/S). Representations of the heterotetramer architectures that closely aligned with PD-PALM resolved images in a, imaged from the extracellular side perpendicular to the membrane surface. Yellow and blue colors indicate LHRB− and LHRS− forms, respectively. Roman numerals in a and b indicate matched complexes. Spheres are centered on the Cα-atom of the first amino acid. The insets are derived from color inverting and enlarging by 2-fold with respect to PD-PALM images from a.
FIGURE 9.
FIGURE 9.
Multiple interfaces mediate LHR di/oligomeric formation. Computational modeling demonstrating potential homo- and heterodimer interfaces, with interfaces in H4-H1 and H3 (a) and H5 contacts (b), characteristic of and possibly through homomeric LHRB− and LHRS− or heteromeric LHRB−/LHRS− interacting pairs. c, interfaces observed in H4, H5-H1, H3, and H5 are unique to the LHRS− homomeric pair. d, interfaces observed in H4, H5, H6-H1, H2, H3, and H5 are unique to the heteromeric LHRB−/LHRS− pair, and e, interface H6-H7 is unique to the homomeric LHRB− interaction. The interfaces are shown from the intracellular side, perpendicular to the membrane plane. The receptor is divided into different colors as follows: ECD, red; TM helices: 1, blue; 2, orange; 3, green; 4, pink; 5, yellow; 6, cyan; and 7, purple with helix 8 also represented in purple. Intracellular and extracellular loops (IL and EL, respectively) are depicted as follows: 1, slate; 2, gray; and 3, magenta. Helices participating in the interface are labeled by the corresponding helix number.

References

    1. Ferré S., Casadó V., Devi L. A., Filizola M., Jockers R., Lohse M. J., Milligan G., Pin J. P., Guitart X. (2014) G protein-coupled receptor oligomerization revisited: functional and pharmacological perspectives. Pharmacol. Rev. 66, 413–434 - PMC - PubMed
    1. Pascal G., Milligan G. (2005) Functional complementation and the analysis of opioid receptor homodimerization. Mol. Pharmacol. 68, 905–915 - PubMed
    1. Urizar E., Montanelli L., Loy T., Bonomi M., Swillens S., Gales C., Bouvier M., Smits G., Vassart G., Costagliola S. (2005) Glycoprotein hormone receptors: link between receptor homodimerization and negative cooperativity. EMBO J. 24, 1954–1964 - PMC - PubMed
    1. Monnier C., Tu H., Bourrier E., Vol C., Lamarque L., Trinquet E., Pin J. P., Rondard P. (2011) Trans-activation between 7TM domains: implication in heterodimeric GABAB receptor activation. EMBO J. 30, 32–42 - PMC - PubMed
    1. Han Y., Moreira I. S., Urizar E., Weinstein H., Javitch J. A. (2009) Allosteric communication between protomers of dopamine class A GPCR dimers modulates activation. Nat. Chem. Biol. 5, 688–695 - PMC - PubMed

Publication types