. 2015 Jan 1;142(1):31-40.
doi: 10.1242/dev.111104.

Mga is essential for the survival of pluripotent cells during peri-implantation development

Affiliations

Mga is essential for the survival of pluripotent cells during peri-implantation development

Andrew J Washkowitz et al. Development. .

Abstract

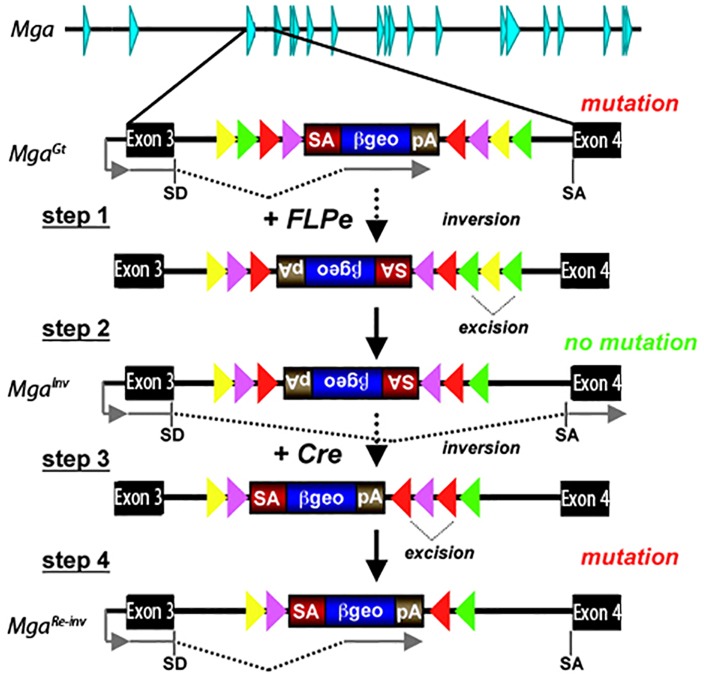
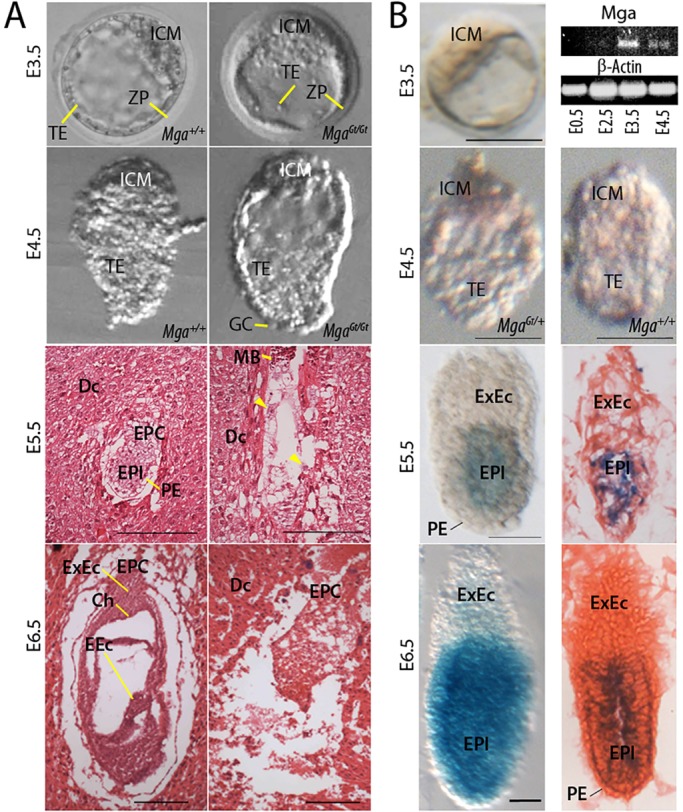
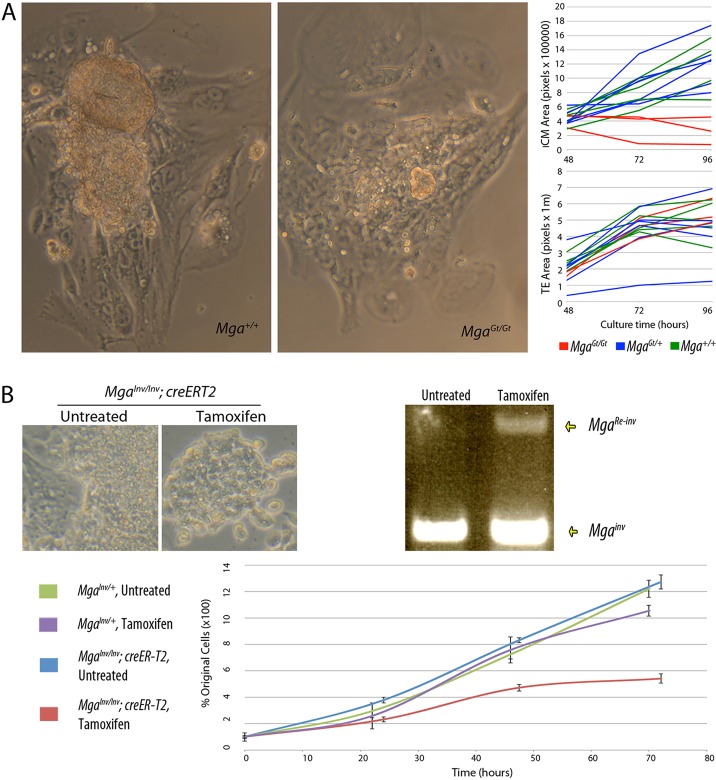
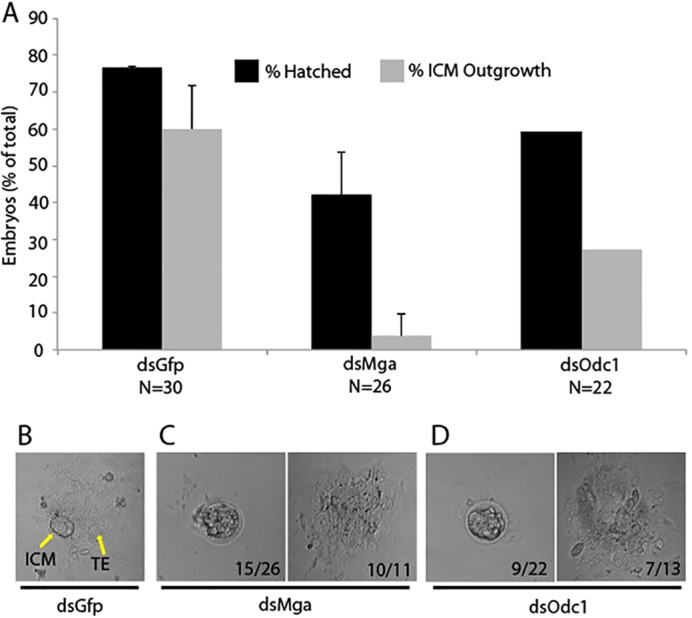
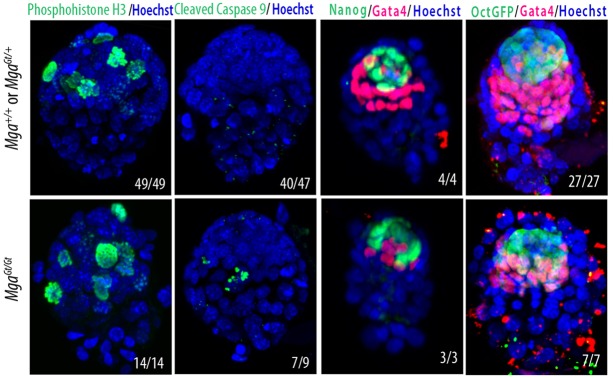
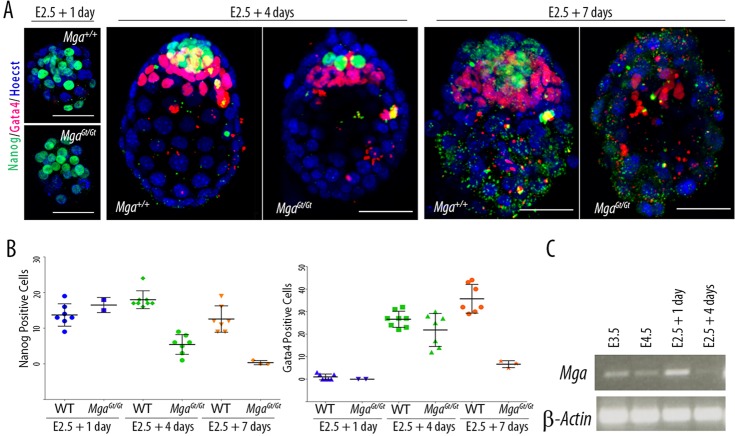
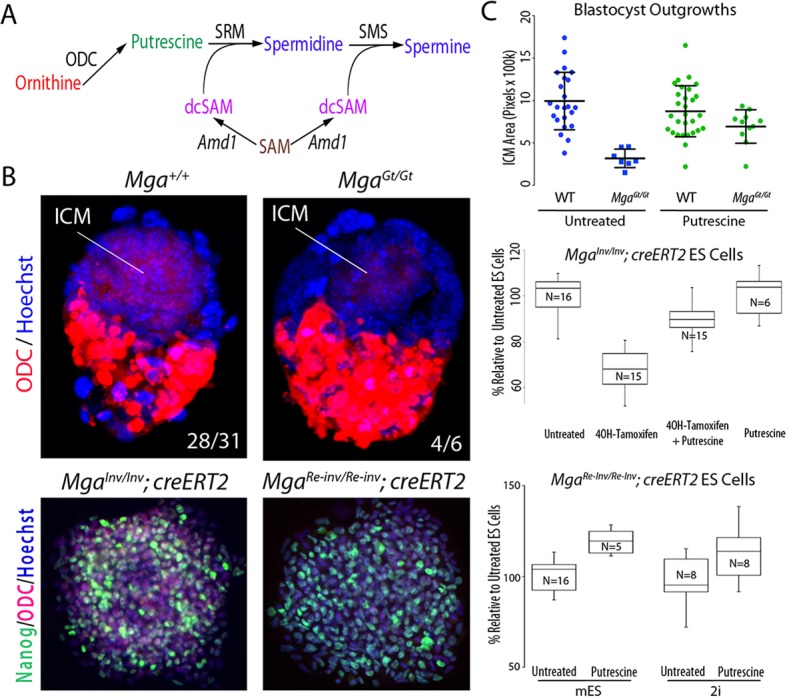
The maintenance and control of pluripotency is of great interest in stem cell biology. The dual specificity T-box/basic-helix-loop-helix-zipper transcription factor Mga is expressed in the pluripotent cells of the inner cell mass (ICM) and epiblast of the peri-implantation mouse embryo, but its function has not been investigated previously. Here, we use a loss-of-function allele and RNA knockdown to demonstrate that Mga depletion leads to the death of proliferating pluripotent ICM cells in vivo and in vitro, and the death of embryonic stem cells (ESCs) in vitro. Additionally, quiescent pluripotent cells lacking Mga are lost during embryonic diapause. Expression of Odc1, the rate-limiting enzyme in the conversion of ornithine into putrescine in the synthesis of polyamines, is reduced in Mga mutant cells, and the survival of mutant ICM cells as well as ESCs is rescued in culture by the addition of exogenous putrescine. These results suggest a mechanism whereby Mga influences pluripotent cell survival through regulation of the polyamine pool in pluripotent cells of the embryo, whether they are in a proliferative or quiescent state.

Keywords: Basic-helix-loop-helix-zipper; ESCs; Mga; Mouse; ODC; Pluripotency; T-box; Transcription factor.


Figures

Fig. 1.
Fig. 1.
The gene trap cassette and Mga mutations produced from the FlpRBG targeting vector. The MgaGt allele orients a splice acceptor-β-galactosidase-neomycin resistance cassette to accept the upstream exon 3 splice site of the Mga locus (top) and to create a mutant truncated reporter protein. After treatment with FLP recombinase (which results in inversion, step 1, and excision, step 2), the splice acceptor is no longer in the proper orientation to accept the upstream splice, and a wild-type transcript is produced by splicing around the inserted cassette. After further treatment with CRE recombinase, inversion and excision (steps 3 and 4) occur to produce the MgaRe-inv allele, which functions like the MgaGt allele producing a truncated reporter protein. Adapted from Schnutgen et al. (2005).
Fig. 2.
Fig. 2.
Mga expression and MgaGt/Gt embryos during peri-implantation development. (A) Development of MgaGt/Gt embryos. Preimplantation embryos at E3.5 and E4.5 appear morphologically normal. In sections, embryo degeneration (right) was detected in 10/39 decidual swellings at E5.5 with some trophoblast giant cells (yellow arrowheads) and 4/10 swellings at E6.5. Other implantation sites contained morphologically normal embryos (left). (B) Mga expression in embryos using the β-galactosidase reporter and RT-PCR. No β-galactosidase activity was observed in blastocysts at E3.5 using X-gal staining. S-gal staining was present in the EPI of E4.5 MgaGt/+ embryos, but not of Mga+/+ embryos. RT-PCR on pooled embryos did not detect any Mga transcripts at E0.5 or E2.5, but expression was present at E3.5 and E4.5 (top right). β-galactosidase staining was observed in the EPI of whole-mounts (on the left) and paraffin sections (on the right) at E5.5 and E6.5. MB, maternal blood; Dc, decidua; EPI. epiblast; EPC, ectoplacental cone; PE, primitive endoderm; ExEc, extraembryonic ectoderm; EEc, embryonic ectoderm; Ch, chorion; ICM, inner cell mass; TE, trophectoderm; ZP, zona pellucida; GC, giant cells. Scale bars: 100 µm.
Fig. 3.
Fig. 3.
In vitro culture shows defective growth of Mga mutant cells. (A) ICM outgrowth from MgaGt/Gt embryos was severely compromised by 4 days of culture compared with WT, as seen by phase contrast microscopy. Measurement of the surface area on individual embryos at daily intervals showed that the ICM of MgaGt/Gt embryos failed to grow (top right), although the increase in TE outgrowth was similar (bottom right). (B) ESC colonies appeared morphologically normal when inversion was induced with tamoxifen (middle), although inversion was incomplete as measured by PCR (right). MgaInv/Inv; creERT2 ESCs grew at a slower rate from the time of addition of tamoxifen at t=0 (bottom).
Fig. 4.
Fig. 4.
Knockdown of Mga or Odc1 results in ICM failure. (A) Results of outgrowth assays following injection with dsGfp, dsMga or dsOdc1. All injection groups developed to the blastocyst stage at similar rates (∼90%, not shown). Percentage of total embryos (N) that hatched and formed ICM outgrowths is shown for each group. (B) Control embryos (dsGfp) form obvious ICM colonies and TE outgrowths (yellow arrows). (C,D) Examples of the failure to hatch and failure to form ICM outgrowth after microinjection of dsMga or dsOdc1. The numbers in the panels refer to the number of embryos out of the total that failed to hatch (as shown) or the number of embryos out of the total that hatched and outgrew that failed to form an ICM (as shown).
Fig. 5.
Fig. 5.
MgaGt/Gt embryos showed more apoptosis, but cell proliferation and differentiation were normal at E4.5. Cell proliferation, as measured by phospho-H3 immunostaining, was similar in MgaGt/Gt compared with Mga+/+ and MgaGt/+ embryos. Confocal Z-stacks of cleaved caspase 9 immunofluorescence showed that more MgaGt/Gt embryos had fragmented nuclei (7/9) than did Mga+/+ and MgaGt/+ embryos (7/47). The pluripotency markers NANOG and POU5F1, as measured by a GFP reporter, are similar in MgaGt/Gt embryos compared with Mga+/+ and MgaGt/+ embryos, as was the PE marker GATA4. Numbers in the panels indicate the number of embryos out to the total with an appearance similar to that shown.
Fig. 6.
Fig. 6.
Pluripotent EPI cells are lost during diapause. (A) Following induction of diapause at E2.5, NANOG-positive cells (green) are gradually lost from MgaGt/Gtembryos. GATA4-positive cells (red) persist longer but decrease in number by E2.5+7 days. Scale bars: 100 µm. (B) The number of NANOG-positive cells is significantly lower in MgaGt/Gt embryos at 4 and 7 days of diapause, whereas GATA4-positive cells are significantly different only at 7 days of diapause. WT includes Mga+/+ and MgaGt/+ embryos. Each point represents one embryo. (C) RT-PCR indicates that one day after diapause is induced, Mga is expressed in wild-type embryos at levels comparable to E3.5 and then declines during diapause.
Fig. 7.
Fig. 7.
Polyamine synthesis pathway and the expression of ODC in E4.5 embryos. (A) ODC is the rate-limiting step in the polyamine synthesis pathway that produces spermine and spermidine. ODC catalyzes the conversion of ornithine to putrescine. Putrescine is then converted into spermidine and spermine with the addition of decarboxylated S-adenosyl-methionine (dcSAM). (B) Projections of confocal Z-stacks show lower levels of ODC (red) in the EPI of MgaGt/Gt embryos at E4.5. Secondary antibody background is present on the TE of all embryos tested (top). MgaRe-inv/Re-inv; creERT2 ESCs treated with putrescine also show a lower level of ODC (red) compared with MgaInv/Inv; creERT2 ESCs when treated with putrescine (bottom). Numbers in panels indicate the number of embryos out of the total with an appearance similar to that shown. (C) ICM surface area after 4 days of culture of treated MgaGt/Gt cultures was greater than of untreated MgaGt/Gt cultures and was not different from treated Mga+/+ or MgaGt/+ cultures (top). Greater numbers of MgaInv/Inv; creERT2 ESCs that had inversion induced with 4OH-tamoxifen were present after 2 days of culture when treated with putrescine than when treated with 4OH-tamoxifen alone. Putrescine alone had no effect (middle). MgaRe-inv/Re-inv; creERT2 ESCs were less affected by exogenous putrescine when cultured in 2i conditions compared with mES conditions (bottom). N=number of replicate culture wells.

References

    1. Artus J., Panthier J.-J. and Hadjantonakis A.-K. (2010). A role for PDGF signaling in expansion of the extra-embryonic endoderm lineage of the mouse blastocyst. Development 137, 3361-3372 10.1242/dev.050864 - DOI - PMC - PubMed
    1. Avilion A. A., Nicolis S. K., Pevny L. H., Perez L., Vivian N. and Lovell-Badge R. (2003). Multipotent cell lineages in early mouse development depend on SOX2 function. Genes Dev. 17, 126-140 10.1101/gad.224503 - DOI - PMC - PubMed
    1. Ayer D. E., Kretzner L. and Eisenman R. N. (1993). Mad: a heterodimeric partner for Max that antagonizes Myc transcriptional activity. Cell 72, 211-222 10.1016/0092-8674(93)90661-9 - DOI - PubMed
    1. Batlle-Morera L., Smith A. and Nichols J. (2008). Parameters influencing derivation of embryonic stem cells from murine embryos. Genesis 46, 758-767 10.1002/dvg.20442 - DOI - PubMed
    1. Baudino T. A. and Cleveland J. L. (2001). The Max network gone mad. Mol. Cell. Biol. 21, 691-702 10.1128/MCB.21.3.691-702.2001 - DOI - PMC - PubMed

Publication types

MeSH terms