. 2015 Jan 1;517(7532):50-55.
doi: 10.1038/nature14063. Epub 2014 Dec 15.

Structure of the rabbit ryanodine receptor RyR1 at near-atomic resolution

Affiliations

Structure of the rabbit ryanodine receptor RyR1 at near-atomic resolution

Zhen Yan et al. Nature. .

Abstract

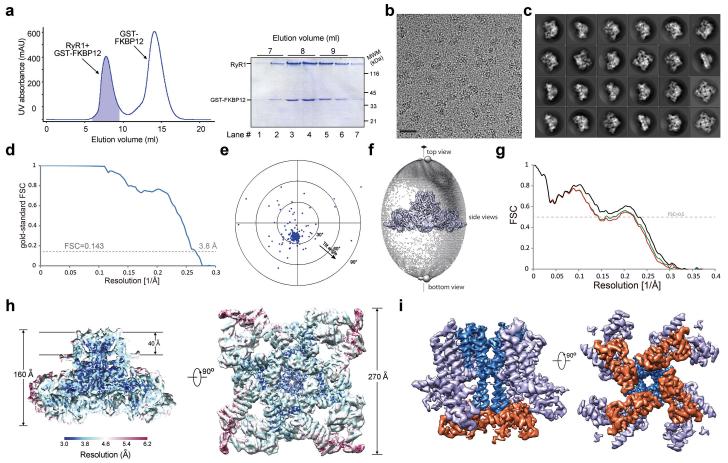
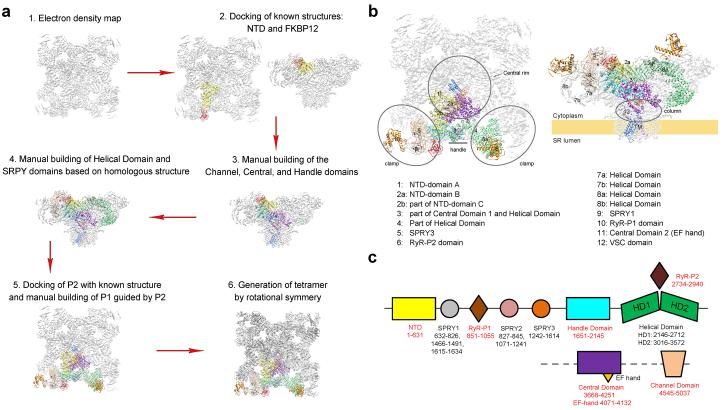
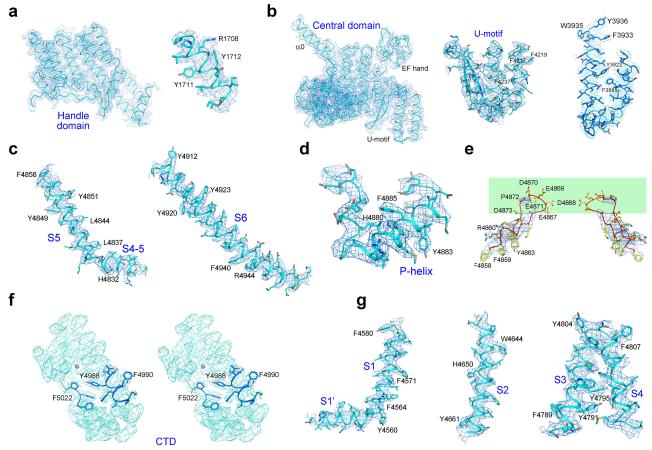
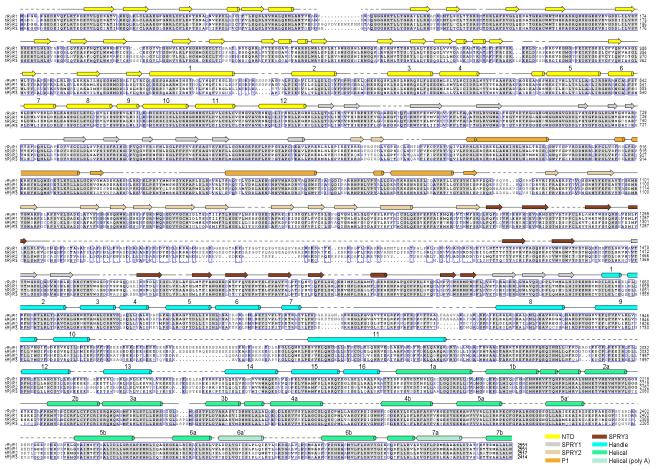
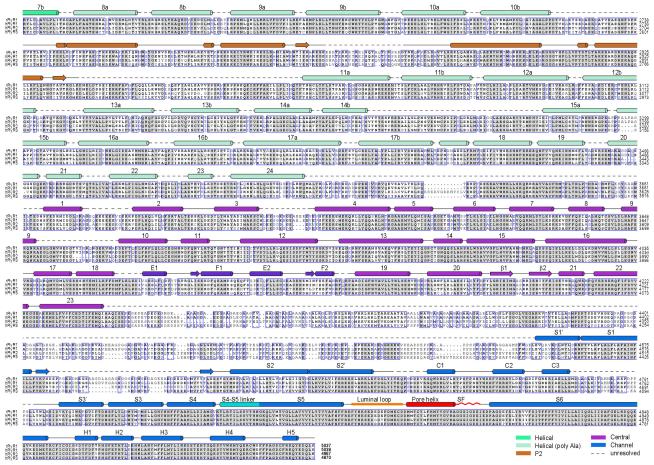
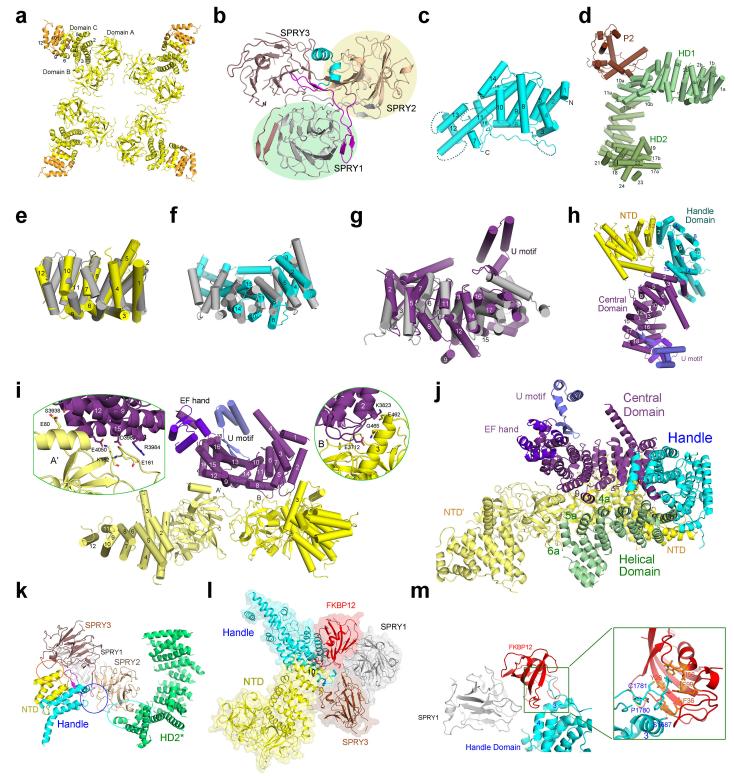
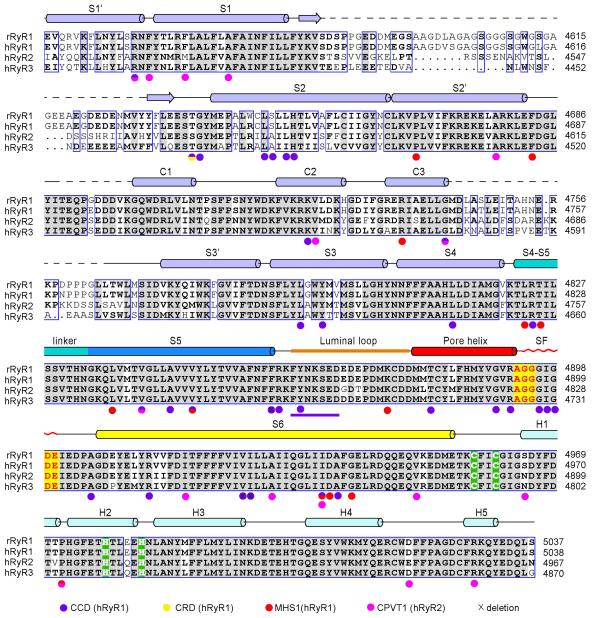
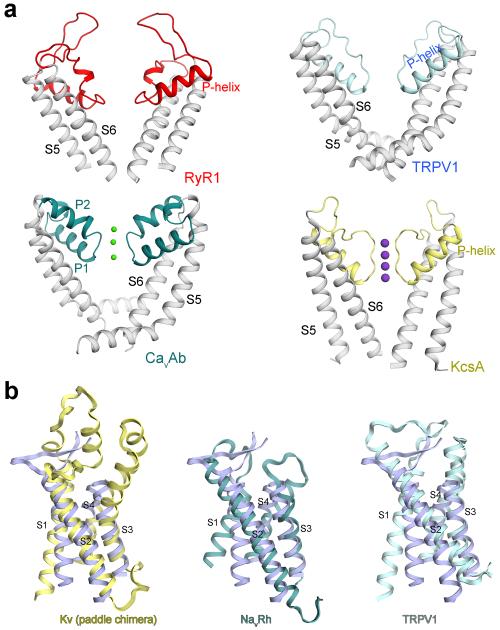
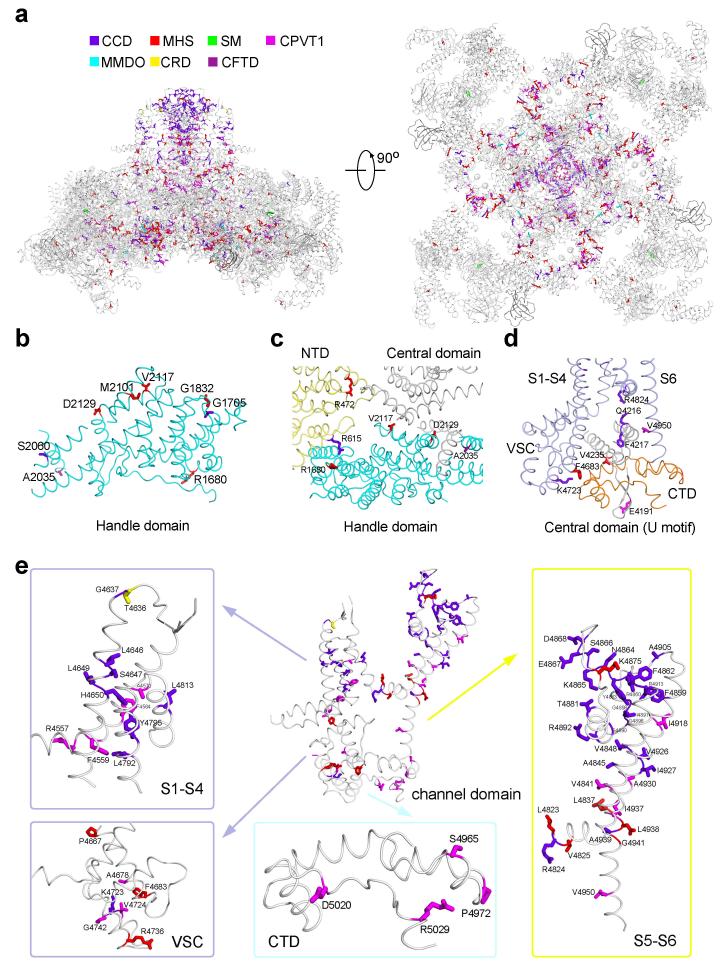
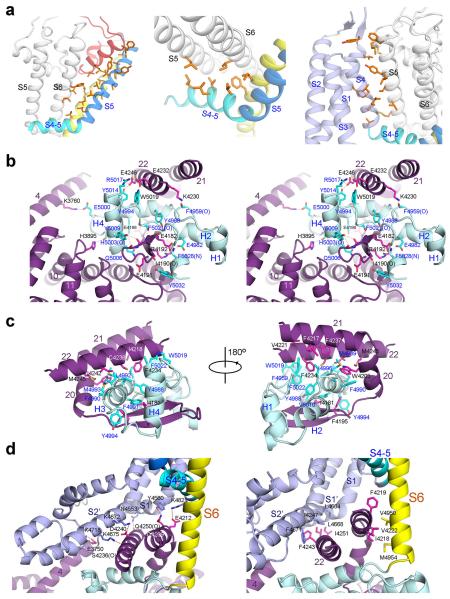
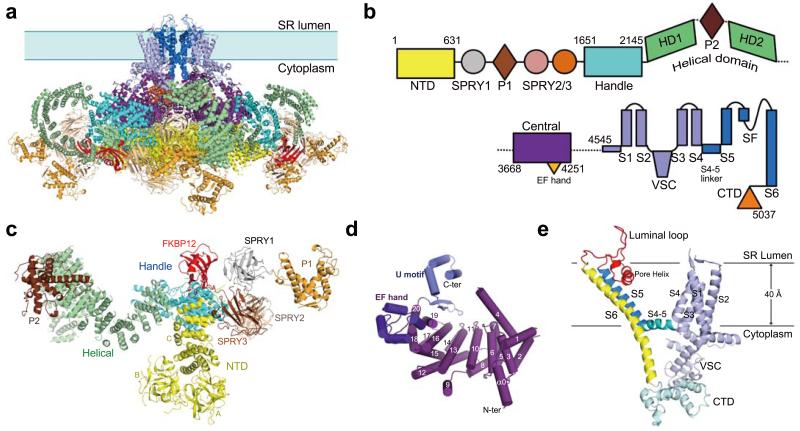
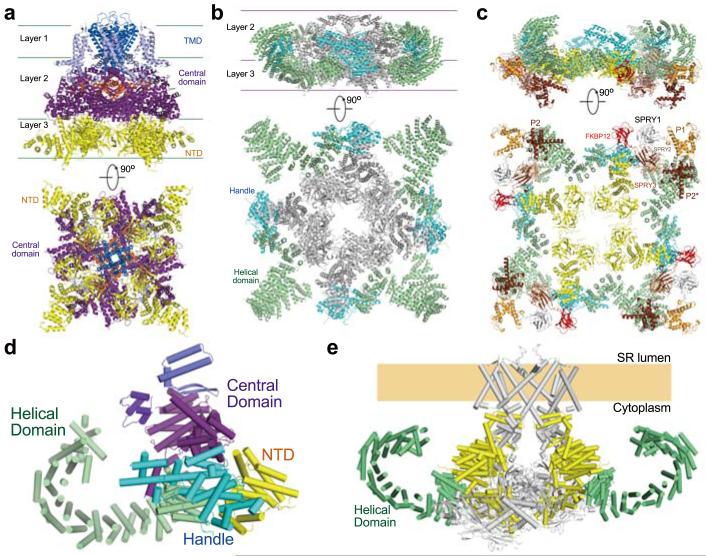
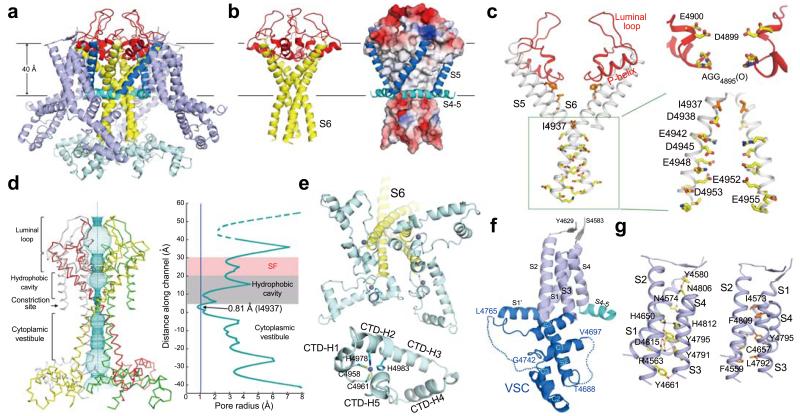
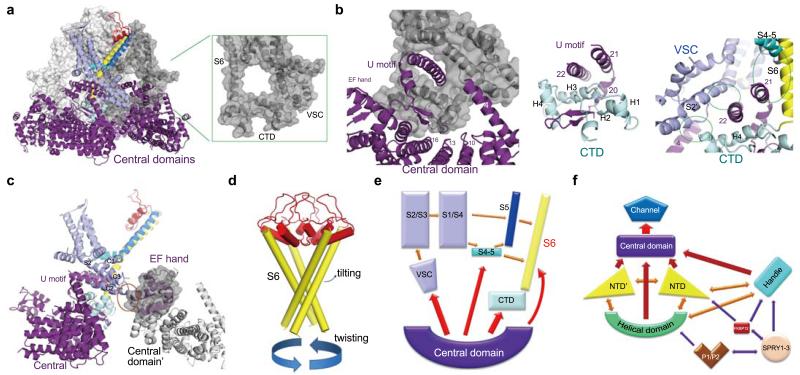
The ryanodine receptors (RyRs) are high-conductance intracellular Ca(2+) channels that play a pivotal role in the excitation-contraction coupling of skeletal and cardiac muscles. RyRs are the largest known ion channels, with a homotetrameric organization and approximately 5,000 residues in each protomer. Here we report the structure of the rabbit RyR1 in complex with its modulator FKBP12 at an overall resolution of 3.8 Å, determined by single-particle electron cryomicroscopy. Three previously uncharacterized domains, named central, handle and helical domains, display the armadillo repeat fold. These domains, together with the amino-terminal domain, constitute a network of superhelical scaffold for binding and propagation of conformational changes. The channel domain exhibits the voltage-gated ion channel superfamily fold with distinct features. A negative-charge-enriched hairpin loop connecting S5 and the pore helix is positioned above the entrance to the selectivity-filter vestibule. The four elongated S6 segments form a right-handed helical bundle that closes the pore at the cytoplasmic border of the membrane. Allosteric regulation of the pore by the cytoplasmic domains is mediated through extensive interactions between the central domains and the channel domain. These structural features explain high ion conductance by RyRs and the long-range allosteric regulation of channel activities.


Figures

Extended Data Figure 1
Extended Data Figure 1. Purification and electron cryo-microscopic (cryo-EM) analysis of the rabbit RyR1 complex bound to the modulator FKBP12
a, The final step of purification of the rabbit RyR1 bound to FKBP12. Shown here are size exclusion chromatogram of the RyR1-FKBP12 complex (left panel) and a SDS-PAGE gel of the peak fractions visualized by Coomassie blue staining (right panel). The shaded fractions in the left panel were pooled for cryo-EM analysis. b, A representative electron micrograph of the rabbit RyR1-FKBP12 complex. The scale bar represents 20 nm. c, 2D class averages of the electron micrographs. d, Gold-standard FSC curves for the density maps. The overall resolution is estimated at 3.8 Å. e, Tilt-pair validation of the correctness of the map. Particles of RYR1 were imaged twice at 0° and 20° tilt angles. The position of each dot represents the direction and the amount of tilting for a particle pair in polar coordinates. Blue and red dots correspond to in-plane and out-of-plane tilt transformations, respectively. Most of the blue dots cluster at a tilt angle of approximately 20°, which validates the structure. f, Angular distribution for the final reconstruction. Each sphere represents one view and the size of the sphere is proportional to the number of particles for that view. The azimuth angle only spans 90°because of the 4-fold symmetry axis that runs from top to bottom. g, FSC curves between the model and the cryo-EM map. Shown here are the FSC curves between the final refined atomic model and the reconstruction from all particles (black), between the model refined in the reconstruction from only half of the particles and the reconstruction from that same half (FSCwork, green), and between that same model and the reconstruction from the other half of the particles (FSCtest, red). h, The overall EM density map of the RyR1-FKBP12 is color-coded to indicate a range of resolutions. Much of the central region of RyR1 is resolved at resolutions better than the overall 3.8 Å, while the periphery of the structure is of much lower resolution. i, EM density map for the channel domain of the rabbit RyR1.Two perpendicular views are shown. The EM density maps were generated in Chimera.
Extended Data Figure 2
Extended Data Figure 2. An illustration of the model building procedures for the RyR1-FKBP12 complex into the EM density map
a, The step-by-step procedures for the generation of the overall structural model and domain assignment. Detailed descriptions can be found in Methods. b, Correlation between the previously assigned sub-regions, and the corresponding domains in our 3.8 Å structure. c, The boundaries of the identified domains in the current structure of RyR1. NTD: amino-terminal domain; SPRY: a domain originally identified in SplA kinase and RyRs; HD: Helical domain. The P2 domain is a phosphorylation hotspot in RyRs. P1 shares homology with P2. The numbers below the domains indicate their sequence boundaries. Those labelled red were identified on the basis of well-defined EM density maps. It is of particular note that the SPRY1/2/3 and P1 domains are intertwined in primary sequences. It is of particular note that the three SPRY domains appear to be intertwined. Refer to Extended Data Fig. 6b for the following structural descriptions. Each SPRY domain consists mainly of a β-sandwich. In addition to the core β-sandwich (residues 639-826), SPRY1 also contains two pairs of anti-parallel β-strands (residues 1466-1491 colored brown and 1615-1634 colored magenta), whose primary sequences are connected to those of SPRY3. Similarly, SPRY2 contains a pair of anti-parallel β-strands (residues 827-845, colored silver) from SPRY1. The sequences of SPRY2 are also interrupted by those of the P1 domain. Consequently, the amino- and the carboxyl-termini of the SPRY1-3 region (residues 639 and 1634) are both contained within the SPRY1 structure.
Extended Data Figure 3
Extended Data Figure 3. EM density maps for the domains whose atomic structural models were generated de novo
a, The EM density maps for the Handle domain. Representative EM density map for one helix in the Handle domain is shown on the right. b, The EM density maps for the Central domain. Left to right: The EM density maps for the overall domain, the U-motif, and one representative helical repeat in the Central domain, respectively. c-g, The EM density maps for the segments in the channel domain. Shown here are the density maps for the pore forming elements (c), the selectivity filter (d), the luminal hairpin loop (e), the carboxyl terminal domain shown in stereo views (f), and the voltage sensor-like domain (g). The maps, shown as blue mesh, are contoured at 4σ and made in PyMol. Representative bulky residues which were used to aid sequence assignment are shown as sticks and labeled.
Extended Data 4
Extended Data 4. Sequence alignment of RyR orthologues
Secondary structural elements are indicated above the sequence alignment and domains are colored the same as the structures shown in the main text figures. The numbering of the secondary elements refers to their sequential positions within the corresponding domains. Invariant amino acids are shaded light grey. The GI codes for the sequences from top to bottom: rabbit RyR1 (156119408), human RyR1 (113204615), human RyR2 (308153558), and human RyR3 (325511382).
Extended Data 5
Extended Data 5. Continued sequence alignment of RyR orthologues
Due to the enormous size of the proteins, the sequence alignment was divided into two figures with an overlap at the helix 7b from the Helical domain. Notably, it was predicted that a number of EF-hand domains may exist between residues 4252 and 4545. The lack of EM density for these domains may indicate their intrinsic flexibility in the absence of Ca2+. The structure and mechanism of these putative EF-hand domains await further investigation.
Extended Data Figure 6
Extended Data Figure 6. Organization of the cytoplasmic domains of RyR1
a, The NTD (yellow) participates in tetramerization. Compared to the previously reported crystal structure of NTD, five additional α-helices (residues 560-631, colored orange) were identified in the EM structure. b, The structure of the SPRY1-3 domains. Refer to Extended Data Fig. 2c for the sequence assignment of the three intertwined domains. Note that the amino-terminus of SPRY1 is preceded by the NTD and its carboxyl-terminus (magenta) is followed by the Handle domain (cyan). c, Structure of the Handle domain. The disordered sequences are indicated by dashed lines. d, The Helical domain comprises two discontinuous sequence fragments, HD1 and HD2, which are disrupted by the P2 domain. e, The helical repeats in subdomain C of the NTD resemble the armadillo repeats. Shown here is a superposition with a designed armadillo protein (PDB code: 4DB8). f, Structural superposition of the Handle domain with β-catenin (PDB code: 3IFQ) suggests that five pairs of helices, 1/2, 4/5, 8/9, 10/11, and 14/15, in the Handle domain exhibit structural homology to the armadillo repeats. g, The helical repeats in the Central domain are armadillo-like repeats. Shown here is the superposition of the Central domain with the armadillo repeats of the anaphase promoting complex (PDB code: 3NMW). h, The armadillo-like repeats in NTD, Handle, Central domains are joined end-to-end to form a superhelical assembly. The appearance of the superhelical assembly resembles a question mark. i, Each Central domain directly interacts with two adjacent NTDs. The convex side of the helical repeats is involved in binding to the NTDs. Two close-up views are shown to highlight key residues that may form hydrogen bonds at the interfaces. j, The NTDs, Central, Handle, and Helical domains form multiple interfaces. Shown here are two adjacent NTDs (NTD and NTD’), one Central domain, one handle Domain, and the N-terminal fragment of the Helical domain. k, SPRY2 bridges the spatial gap between the Handle domain and HD2 from the adjacent protomer. l, FKBP12 is bound in a cleft formed by the Handle, NTD, and SPRY1/3 domains. m, An extended hydrophobic loop from the Handle domain reaches into the ligand-binding pocket of FKBP12. A close-up view is shown to illustrate the residues that may mediate the interactions.
Extended Data Figure 7
Extended Data Figure 7. Alignment of the channel domain sequences of RyR orthologues
Secondary structural elements are indicated above the sequence alignment. Invariant amino acids are shaded in grey. The residues that may constitute potential cation binding sites are cored red. The C2H2 zinc finger motif is highlighted with green background. The residues whose mutations or deletions have been identified in patients are indicated with colored circles below the sequences. The color code is annotated at the bottom. CCD: central core disease; CRD: core/rod disease; MHS: malignant hyperthermia susceptibility; CPVT1: catecholaminergic polymorphic ventricular tachycardia type 1.
Extended Data Figure 8
Extended Data Figure 8. Structural comparison of the RyR1 channel domain with representative tetrameric cation channels of known structures
a, Structural comparison of the pore forming elements from different tetrameric cation channels of known structures. Two diagonal protomers are shown. In all the structures, the S5 and S6 segments are colored grey. In the structures of CavAb and KcsA, the bound ions are shown as spheres. PDB accession codes: 4MW3 for CavAb, 3J5Q for TRPV1, and 1BL8 for KcsA. b, Structural comparison of the transmembrane region of RyR1-VSL to the VSDs or like domains in the indicated tetrameric ion channels. Note that a hydrophilic sequence between S1 and S2 (residues 4579-4639) exhibits poor EM density and constitutes the least conserved DR1 region (DR for “divergent”) in the RyR1 channel domain (Extended Data Fig. 7). The ordered segments within this sequence form a pair of short anti-parallel β-strands that extends into the SR lumen. PDB accession codes: 2R9R for the Kv1.2/Kv2.1 paddle chimera, 4DXW for NavRh, and 3J5P for TRPV1.
Extended Data Figure 9
Extended Data Figure 9. Mapping of the disease-associated point mutations onto the structure of the RyR1 channel domain
a, The residues that are targeted for disease-derived mutations are highlighted by different colors: purple blue for CCD (central core disease), red for MHS (malignant hyperthermia susceptibility), green for SM (samaritan myopathy), cyan for MMDO (minicore myopathy with ophthalmoplegia), yellow for CRD (core/rod disease), dark purple for CFTD (congenital fiber type disproportion), and magenta for CPVT1 (catecholaminergic polymorphic ventricular tachycardia type 1). Please refer to the Supplementary Table 1 for details of these mutations. b, Disease-related mutations in the Handle domain. The concerned residues, which are positioned on the surface of the Handle domain, may be involved in the interaction with modulators or other domains within RyR1. c, Disease-related residues aligning the inter-domain interface between NTD, the Handle and Central domains. d, Representative disease-related residues involved in the interaction between the Central domain and the channel domain. e, The channel domain represents a hotspot for mutations associated with a number of diseases. Please refer to Extended Data Fig. 7 and Supplementary Table 1 for details of the mutations.
Extended Data Figure 10
Extended Data Figure 10. Intra- and inter-domain interactions that may be important for the long-range allosteric regulation of channel gating
a, Extensive van der Waals interactions exist between the pore-forming segments, and between the VSL of one protomer and S6 of adjacent protomer. These extensive interactions may aid the coupling of conformational changes within the channel domain. One protomer is color coded, whereas the adjacent one is colored silver. b, A stereo view of the polar interaction network between the Central domain and CTD. Potential H-bonds are shown as red dashed lines. c, The van der Waals contacts between the U-motif of the Central domain and the CTD. Two opposite views are shown. d, Interactions between the Central domain and the VSL. Polar and van der Waals contacts are shown on the left and right, respectively.
Figure 1
Figure 1. Overall structure and domain organization of the rabbit RyR1
a, Structure of the tetrameric RyR1 in complex with FKBP12. In all side views, the structure is presented with the SR luminal side on the top. b, A schematic illustration of domain organization in one RyR1 protomer. The annotation for domain abbreviations and detailed boundaries are reported in Extended Data Fig. 2c. c, Spatial arrangement of the cytoplasmic domains preceding the Central domain within one RyR1 protomer. Shown here is a cytoplasmic view. d, Structure of the Central domain. The Central domain comprises an armadillo repeat-like superhelical assembly of 20 α-helices, an EF-hand domain on the ridge of the assembly, and a U-motif at the carboxyl-terminus. e, Structure of the channel domain from one RyR1 protomer. All structure figures were prepared using PyMol.
Figure 2
Figure 2. Hierarchical organization of the tetrameric RyR1
a, A three-layered central tower forms the core of RyR1. The Central domain is the only cytoplasmic structure that directly interacts with the channel domain. b, The Handle and the Helical domains form a corona around the central tower. For visual clarity, NTD and the Central domain are colored grey and the channel domain is omitted. c, The peripheral domains of RyR1 attach to the corona. The Central domains and the channel domain are omitted. d, Two superhelical assemblies form a scaffold in the cytoplasmic region in each RyR protomer. The Helical domain constitutes one superhelical assembly; the armadillo-like repeats from NTD, the Handle and Central domains constitute the other. e, The two superhelical assemblies provide the binding scaffold and the adaptability for the propagation of conformational changes. Only two diagonal molecules are shown. The superhelical assemblies formed by NTD, the Handle and Central domains are colored yellow, the Helical domains are colored green, and the rest in grey.
Figure 3
Figure 3. Structure of the channel domain of RyR1
a, The transmembrane region of the RyR1 channel domain exhibits a VGIC fold. The structural elements are color-coded as in Fig. 1e. b, The ion-conducting pore of RyR1 is formed by S6 segments and the selectivity filter (SF). Shown here are cartoon representation (left) and electrostatic surface potential (right), calculated by PyMol. c, Structural analysis of the ion-conducting pathway. Shown here are two diagonal protomers (left) and a close-up view on an enlarged SF vestibule and the cytoplasmic segments of S6 (right). d, The RyR1 channel is closed at the cytoplasmic activation gate. The channel passage, calculated by HOLE, is depicted by cyan dots (left). The pore radii along the ion-conducting pathway are tabulated (right) where the dashed lines indicate segments of poor EM densities. The position of the S4-5 helical axis is set as the origin of the Y-axis. e, A unique carboxyl-terminal domain (CTD) is tightly connected to S6 in each RyR1 protomer. Lower panel: Structure of one CTD where a C2H2-type ZF motif is identified. The zinc atom is shown as a purple sphere. f, Structure of the voltage sensor-like (VSL) domain in one protomer. The disordered sequences are indicated by dashed lines. g, The transmembrane segments S1-S4 interact closely with each other. Potential hydrogen bonds are shown as red dashed lines.
Figure 4
Figure 4. The intra- and inter-domain contacts of the RyR1 channel domain may contribute to channel gating
a, VSC and CTD mediate the interactions between the channel domain and the Central domain in the cytoplasmic region of RyR1. Shown in the inset is a circle formed by the cytoplasmic fragment of S6, CTD, and VSC that provides the primary accommodation site for the Central domain. Only one protomer is domain-colored, and the other three protomers are shown in light to dark grey in semi-transparent surface view. b, Analysis of the interactions between the channel domain and the Central domain. The green circles in the right panel indicate the interfaces between the Central domain and the channel domain. Detailed interactions can be found in Extended Data Fig. 10. c, The EF-hand sub-domain in the Central domain contacts VSC and may provide the molecular basis for Ca2+-mediated modulation of RyR1. A semi-transparent surface is shown for the EF-hand sub-domain. The potential interface is highlighted by the orange circle. d, Putative conformational changes of the S6 segments may result in the opening of the activation gate. e, A cartoon diagram to illustrate the actions from the surrounding domains and structural segments that may lead to conformational changes of S6. f, A cartoon illustration of the complex interactions among the different domains of RyR1. Each arrow denotes two mutually interacting domains. Single-headed arrows indicate the directions of allosteric changes, whereas double-headed arrows suggest two-way flow of conformational changes.

References

    1. Pessah IN, Waterhouse AL, Casida JE. The calcium-ryanodine receptor complex of skeletal and cardiac muscle. Biochem Biophys Res Commun. 1985;128:449–56. - PubMed
    1. Inui M, Saito A, Fleischer S. Purification of the ryanodine receptor and identity with feet structures of junctional terminal cisternae of sarcoplasmic reticulum from fast skeletal muscle. J Biol Chem. 1987;262:1740–7. - PubMed
    1. Lai FA, Erickson HP, Rousseau E, Liu QY, Meissner G. Purification and reconstitution of the calcium release channel from skeletal muscle. Nature. 1988;331:315–9. - PubMed
    1. Takeshima H, et al. Primary structure and expression from complementary DNA of skeletal muscle ryanodine receptor. Nature. 1989;339:439–45. - PubMed
    1. Rossi D, Sorrentino V. Molecular genetics of ryanodine receptors Ca2+-release channels. Cell Calcium. 2002;32:307–19. - PubMed

Publication types

MeSH terms

Substances

Associated data