. 2014 Dec 16;107(12):2941-2949.
doi: 10.1016/j.bpj.2014.10.055.

The kinetic stability of cytochrome C oxidase: effect of bound phospholipid and dimerization

Affiliations

The kinetic stability of cytochrome C oxidase: effect of bound phospholipid and dimerization

Erik Sedlák et al. Biophys J. .

Abstract

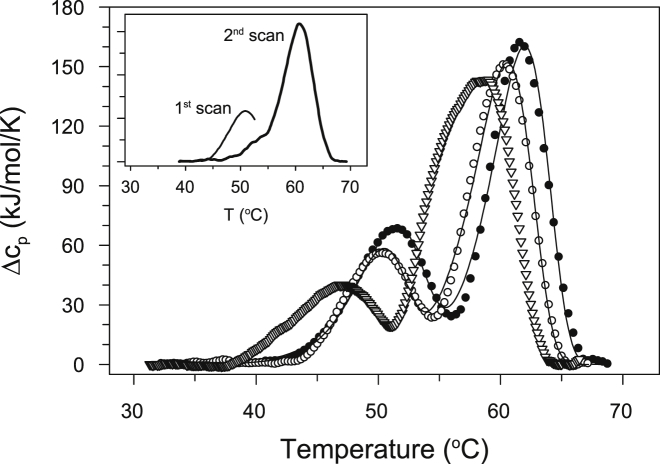
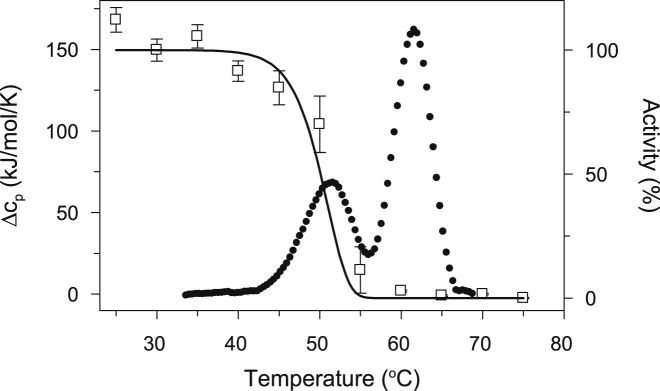
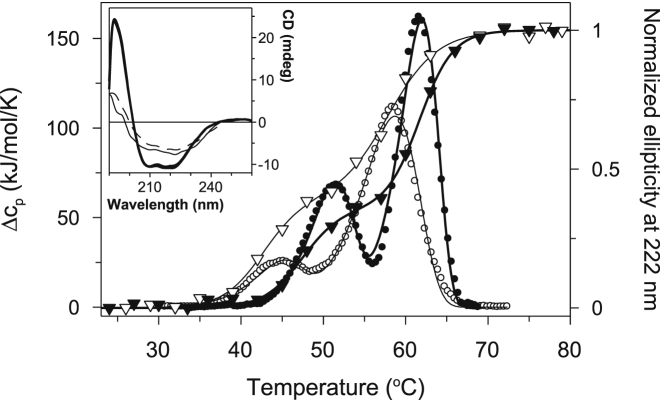
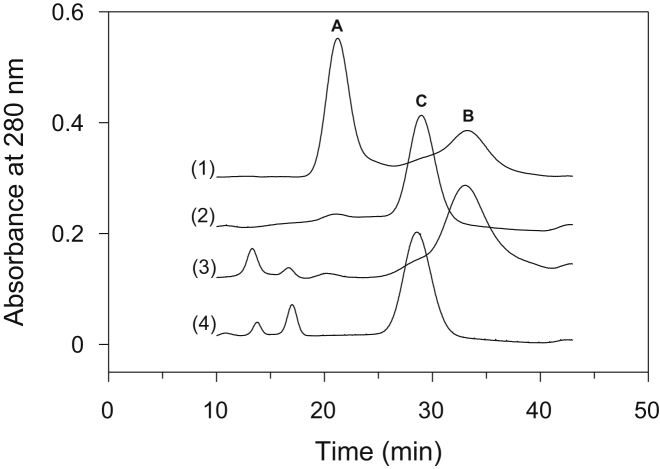
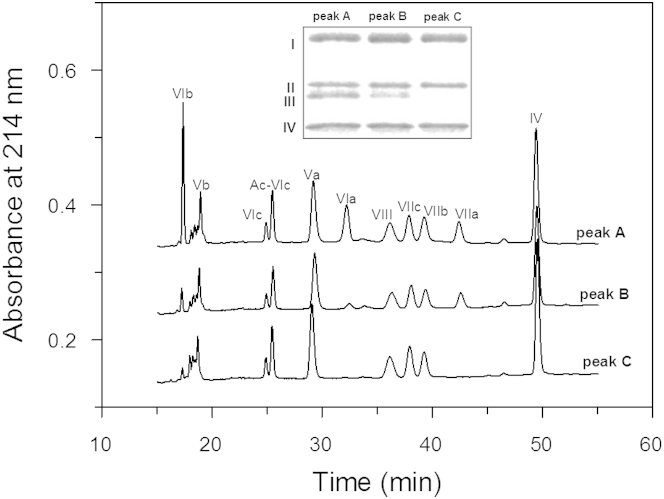
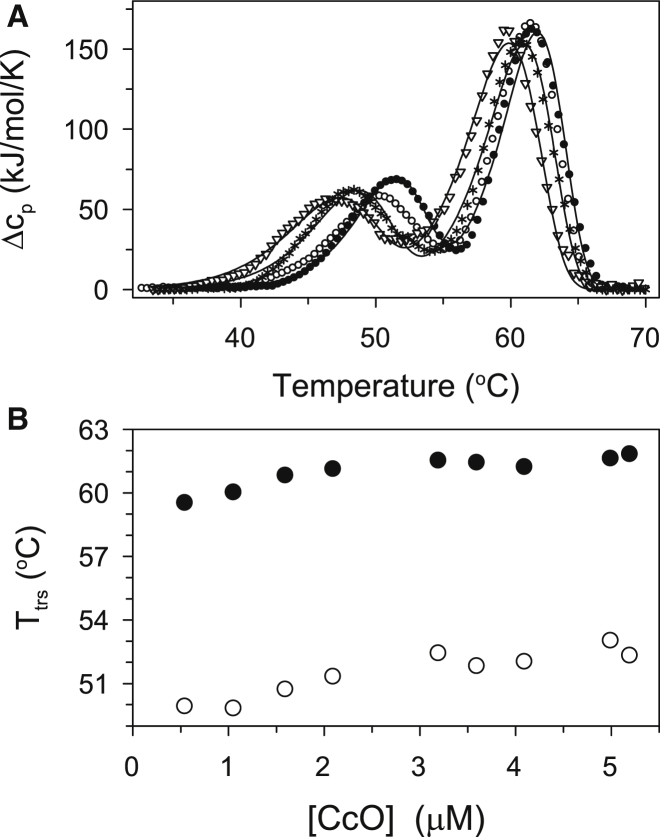
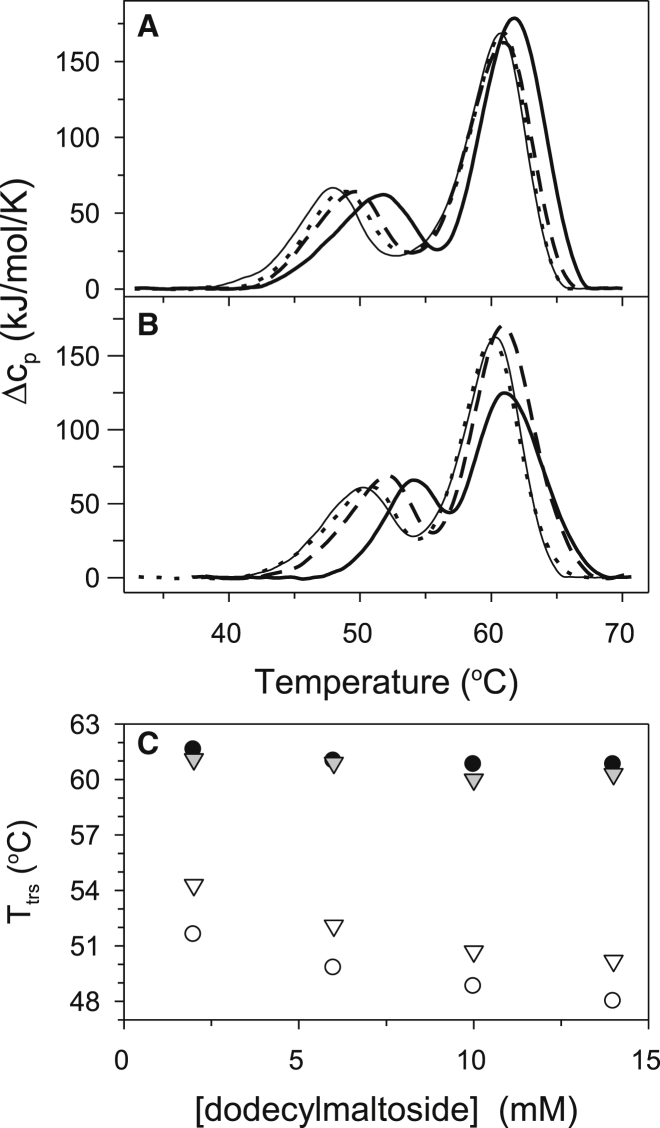
Thermally induced transitions of the 13-subunit integral membrane protein bovine cytochrome c oxidase (CcO) have been studied by differential scanning calorimetry (DSC) and circular dichroism (CD). Thermal denaturation of dodecyl maltoside solubilized CcO proceeds in two consecutive, irreversible, kinetically driven steps with the apparent transition temperatures at ∼ 51°C and ∼ 61°C (5μM CcO at scan rate of 1.5 K/min). The thermal denaturation data were analyzed according to the Lyubarev and Kurganov model of two consecutive irreversible steps. However, because of the limitation of the model to describe the complex mechanism of the thermal denaturation of CcO, the obtained results were utilized only for comparison purposes of kinetic stabilities of CcO under specific protein concentration (5μM) and scan rate (1.5 K/min). This enabled us to show that both the amphiphilic environment and the self-association state of CcO affect its kinetic stability. Kinetic stabilities of both steps are significantly decreased when all of the phospholipids are removed from CcO by phospholipase A2 (the half-life decreases at 37°C). Conversely, dimerization of CcO induced by sodium cholate significantly increases its kinetic stability of only the first step (the half-life increases at 37°C). Protein concentration-dependent nonspecific oligomerization also indicate mild stabilization of CcO. Both, reversed-phase high-performance liquid chromatography (HPLC) and SDS-PAGE subunit analysis reveal that the first step of thermal denaturation involves dissociation of subunits III, VIa, VIb, and VIIa, whereas the second step is less well defined and most likely involves global unfold and aggregation of the remaining subunits. Electron transport activity of CcO decreases in a sigmoidal manner during the first transition and this dependence is very well described by kinetic parameters for the first step of the thermal transition. Therefore, dissociation of subunit III and/or VIIa is responsible for temperature-induced inactivation of CcO because VIa and VIb can be removed from CcO without affecting the enzyme activity. These results demonstrate an important role of tightly bound phospholipids and oligomeric state (particularly the dimeric form) of CcO for kinetic stability of the protein.


Figures

Figure 1
Figure 1
Thermal transitions of PL-containing CcO as monitored by DSC. Measurements were performed at three different scan rates: 0.5 K/min (open triangles), 1.0 K/min (open circles), and 1.5 K/min (solid circles); theoretical fits based on Eq. 8 are shown as solid lines. The dependence of the thermal transition temperatures on the scan rate indicates that thermal denaturation of CcO is under kinetic control. Inset: DSC scan of CcO heated at a scan rate of 1.5 K/min until 54°C (first scan, thin line), recooled to 25°C, and rescanned at the same scan rate (second scan, thick line). The fact that the first thermal transition is absent during the second scan indicates the irreversibility of the first thermal CcO transition. All DSC experiments used 5 μM CcO solubilized in 2 mM DM in 20 mM TrisHCl, pH 8.0.
Figure 2
Figure 2
Comparison of the temperature dependence of CcO activity with the DSC-monitored thermal transitions. Experimental data are shown as symbols: DSC (solid circles) and CcO activity (open squares). The solid line represents the percent of the native state population, γN, calculated using Eq. 6 and the parameters obtained from fitting of the DSC thermal transition data. The coincident decrease of CcO activity and the population of the CcO native state indicate that temperature-induced conformational changes occurring during the first thermal transition are critical for CcO activity. The measurements were performed at the same conditions as described in Fig. 1.
Figure 3
Figure 3
Comparison of thermal transitions of CcO as monitored by CD and DSC. Experimental data are shown as symbols: PL-containing CcO (solid symbols), PL-free CcO (open symbols), DSC data (circles), and CD data (triangles). Theoretical fits to CD and DSC data (solid lines) are based on Eqs. 1 and 8, respectively. Fits are shown for both PL-containing CcO (thick line) and PL-free CcO (thin line). The fraction unfolded as monitored by CD were normalized to vary between 0 and 1 as the temperature was raised from 0°C to 80°C (see inset figure). Removal of bound phospholipid from CcO shifts both thermal transitions to lower temperatures, whether monitored by CD or DSC. Inset: CD spectra of PL-containing CcO (solid lines) and PL-free CcO (dashed lines) measured at either 25°C (thick lines) or 80°C (thin lines). CD spectra of both CcO forms at 25°C are overlapping. CD spectra at 80°C indicate that 50% to 60% of the native secondary structure remains in the thermally denatured states of both forms of CcO. DSC and CD experiments were performed using 5 μM CcO solubilized in 20 mM TrisHCl, pH 8.0 containing 2 mM DM at a scan rate of 1.5 K/min.
Figure 4
Figure 4
Analysis of PL-containing and PL-free CcO by HiTrap Q FPLC anion-exchange chromatography before and after they were heated through the first-step transition. Chromatograms (1) and (2) were obtained for PL-containing CcO before and after heating to 54°C followed by cooling to 23°C, respectively. Chromatograms (3) and (4) were obtained for PL-free CcO before and after it had been heated and cooled in an identical manner. CcO that eluted in peaks A, B, and C were collected and analyzed by reversed phase-HPLC (refer to Fig. 5).
Figure 5
Figure 5
Subunit composition of CcO before and after the first thermal transition. Nuclear-encoded CcO subunits were analyzed by C18 reversed-phase HPLC (main figure); mitochondrial-encoded subunits were analyzed by SDS-PAGE (inset). Chromatograms labeled as peak A, B, and C represent HPLC of fractions collected under peaks A, B, and C from Fig. 4, respectively. Chromatograms for peaks A and B were those obtained for intact CcO (13-subunit form of CcO) and PL-free CcO (11-subunit form of CcO) before each being heated above 25°C. Chromatogram for peak C was that obtained for PL-containing CcO after it had been heated to 54°C. An identical chromatogram was obtained for peak C material obtained from PL-free CcO that had been heated to 52°C. Analysis of peak C material, whether it had been isolated from either PL-containing or PL-free, had an identical subunit composition. Inset: SDS-PAGE analysis of mitochondrial-encoded CcO subunits composition of intact, PL-containing CcO before (peaks A and B) and after heating to 54°C (peak C). Identical SDS-PAGE results were obtained for peak B and C material that had been isolated from PL-free CcO.
Figure 6
Figure 6
DSC scans and fitting parameters obtained for PL-containing CcO as a function of protein concentration. (A) DSC scans obtained with 0.55 μM (triangles), 1.6 μM (asterisks), 3.2 μM (open circles), and 5.0 μM (solid circles) CcO. (B) Dependence of aparent temperature, Ttrs, of thermal transitions of the first (open circles) and the second step (solid circles) of thermal denaturation. In each case CcO was solubilized in 20 mM TrisHCl, pH 8.0 containing 2 mM DM, and the DSC data were acquired using a scan rate of 1.5 K/min.
Figure 7
Figure 7
DSC scans obtained for PL-containing CcO in the absence (A) and in the presence (B) of 2 mM sodium cholate with increasing concentration of DM: 2 mM (solid thick line), 6 mM (dashed), 10 mM (dotted), and 14 mM (solid thin). (C) The DM dependence of the apparent transition temperature, Ttrs, for the first (open symbols) and the second (solid symbols) stages of CcO thermal denaturation in the absence (circles) or presence (triangles) of 2 mM sodium cholate. All DSC data were acquired at a scan rate of 1.5 K/min using 5 μM phospholipid-containing CcO solubilized in 20 mM TrisHCl, pH 8.0 buffer containing the indicated concentration of DM and either 0 or 2 mM sodium cholate.

References

    1. Kadenbach B., Jarausch J., Merle P. Separation of mammalian cytochrome c oxidase into 13 polypeptides by a sodium dodecyl sulfate-gel electrophoretic procedure. Anal. Biochem. 1983;129:517–521. - PubMed
    1. Tsukihara T., Aoyama H., Yoshikawa S. The whole structure of the 13-subunit oxidized cytochrome c oxidase at 2.8 A. Science. 1996;272:1136–1144. - PubMed
    1. Sedlák E., Robinson N.C. Phospholipase A(2) digestion of cardiolipin bound to bovine cytochrome c oxidase alters both activity and quaternary structure. Biochemistry. 1999;38:14966–14972. - PubMed
    1. Sedlák E., Panda M., Robinson N.C. Photolabeling of cardiolipin binding subunits within bovine heart cytochrome c oxidase. Biochemistry. 2006;45:746–754. - PMC - PubMed
    1. Shinzawa-Itoh K., Aoyama H., Yoshikawa S. Structures and physiological roles of 13 integral lipids of bovine heart cytochrome c oxidase. EMBO J. 2007;26:1713–1725. - PMC - PubMed

Publication types