. 2015 Jul;21(7):671-82.
doi: 10.1089/ten.TEC.2014.0527. Epub 2015 Mar 12.

Noninvasive Quantitative Imaging of Collagen Microstructure in Three-Dimensional Hydrogels Using High-Frequency Ultrasound

Affiliations

Noninvasive Quantitative Imaging of Collagen Microstructure in Three-Dimensional Hydrogels Using High-Frequency Ultrasound

Karla P Mercado et al. Tissue Eng Part C Methods. 2015 Jul.

Abstract

Collagen I is widely used as a natural component of biomaterials for both tissue engineering and regenerative medicine applications. The physical and biological properties of fibrillar collagens are strongly tied to variations in collagen fiber microstructure. The goal of this study was to develop the use of high-frequency quantitative ultrasound to assess collagen microstructure within three-dimensional (3D) hydrogels noninvasively and nondestructively. The integrated backscatter coefficient (IBC) was employed as a quantitative ultrasound parameter to detect, image, and quantify spatial variations in collagen fiber density and diameter. Collagen fiber microstructure was varied by fabricating hydrogels with different collagen concentrations or polymerization temperatures. IBC values were computed from measurements of the backscattered radio-frequency ultrasound signals collected using a single-element transducer (38-MHz center frequency, 13-47 MHz bandwidth). The IBC increased linearly with increasing collagen concentration and decreasing polymerization temperature. Parametric 3D images of the IBC were generated to visualize and quantify regional variations in collagen microstructure throughout the volume of hydrogels fabricated in standard tissue culture plates. IBC parametric images of corresponding cell-embedded collagen gels showed cell accumulation within regions having elevated collagen IBC values. The capability of this ultrasound technique to noninvasively detect and quantify spatial differences in collagen microstructure offers a valuable tool to monitor the structural properties of collagen scaffolds during fabrication, to detect functional differences in collagen microstructure, and to guide fundamental research on the interactions of cells and collagen matrices.


Figures

<b>FIG. 1.</b>
FIG. 1.
Schematics of experimental setups. (A) Collagen gels (16 mm thick, 20 mm in diameter) were fabricated in cylindrical Teflon sample holders sealed with Saran™ membranes. The sample and the transducer were placed in a water tank with degassed, deionized water. (B) Acellular collagen gels (2, 4, or 9 mm thick) and gels with cells (9-mm thick gel with 4×10⁵ cells/mL) were fabricated in 12-well tissue culture plates. After collagen polymerization was complete, wells were filled with cell culture media, and a water standoff was placed above the well to provide a path for acoustic propagation. The tissue culture plate was positioned at the top of a water tank to reduce reflections from the bottom of the plate. In both setups, a single-element transducer was aligned using a 3-axis positioner such that its focus was within the collagen gel. A pulse/receiver supplied radio-frequency (RF) signals that excited the transducer, and received the backscattered RF signals from the gel.
<b>FIG. 2.</b>
FIG. 2.
Schematics of analyses of backscatter RF signals. (A) B-scan imaging and integrated backscatter coefficient (IBC) estimation of acellular collagen gels fabricated in Teflon sample holders. The transducer focus was positioned at an axial depth of 2 mm in the gel. Five independent B-scan imaging planes were scanned for each gel. A region of interest (ROI) was selected for each imaging plane and was comprised of 48 independent RF lines (5 mm lateral length) that were 1 mm axially (i.e., 25 pulse lengths long). The IBC was then calculated for each ROI. (B) Schematic demonstrating volumetric IBC imaging of acellular collagen gels fabricated in a tissue culture plate. Seven, independent B-scan imaging planes were obtained corresponding to regions located at the center, and 3, 6, and 8 mm in either direction from the gel center. Each scan encompassed the entire lateral distance of the gel. The transducer focus was positioned at various depths in the gel. In each imaging plane, multiple ROIs were selected to increase spatial resolution. Each ROI had dimensions of one axial pulse length (41 μm long) and eight RF lines (850 μm laterally). The IBC was calculated for each ROI, and a parametric image of the IBC was generated for each imaging plane. (C) Schematic of a C-scan imaging plane at the middle of a collagen gel fabricated in a tissue culture plate. (D) The middle section of the gel in the tissue culture plate was selected and divided into multiple 3D ROIs, each comprised of nine RF lines (three RF lines laterally, three RF lines transaxially) with an axial depth of 1 mm. The IBC was calculated for each ROI, and a parametric image was generated as a 2D IBC map in the lateral-transaxial plane.
<b>FIG. 3.</b>
FIG. 3.
Acoustic attenuation coefficients of collagen hydrogels. The insertion-loss technique was used to measure attenuation coefficients of collagen gels in Teflon sample holders (with intervening Saran membrane) fabricated with (A) 1 mg/mL (black triangles), 2 mg/mL (light gray circles), or 4 mg/mL collagen (dark gray squares) polymerized at 37°C, and (B) 2 mg/mL collagen polymerized at 22°C (gray circles) or 37°C (black triangles). Mean±standard deviation of measured attenuation coefficients are shown (n=4 collagen gels per fabrication condition). The solid lines represent power law fits to the measured data. The power law fit equations of the attenuation data for 1, 2, and 4 mg/mL collagen are α=0.012f1.6, α=0.016f1.6, and α=0.024f1.5, respectively, where α is the attenuation coefficient (dB/cm) and f is the ultrasound frequency (MHz). The power law fits to the data corresponding to the 2 mg/mL collagen polymerized at 22°C and 37°C are α=0.017f1.6 and α=0.015f1.6, respectively.
<b>FIG. 4.</b>
FIG. 4.
Second harmonic generation microscopy images of collagen fibers in hydrogels. Collagen gels were fabricated in Teflon holders using (A) 1, 2, or 4 mg/mL collagen polymerized at 37°C, or (B) 2 mg/mL collagen polymerized at 22°C or 37°C. Imaging was performed at the center of the gel, and images were collected in the z-direction in 5-μm steps at depths from 450 to 550 μm below the gel surface. Images were then projected onto the z-plane using ImageJ software. Scale bar, 50 μm.
<b>FIG. 5.</b>
FIG. 5.
B-scan images of collagen hydrogels. Shown are representative B-scan images of collagen gels that were fabricated in Teflon holders with (A) 1, 2, or 4 mg/mL collagen polymerized at 37°C, or (B) 2 mg/mL collagen polymerized at 22°C or 37°C. B-scan imaging was performed at five independent imaging planes in each gel (n=5 samples per fabrication condition). The transducer was focused at an axial depth of 2 mm. Scale bar, 1 mm.
<b>FIG. 6.</b>
FIG. 6.
IBC as a function of collagen concentration and polymerization temperature. Collagen gels were fabricated in Teflon sample holders using (A) 1, 2, or 4 mg/mL collagen polymerized at 37°C, or (B) 2 mg/mL collagen polymerized at 22°C or 37°C. The transducer was focused at an axial depth of 2 mm in the gel. The IBC was estimated using the backscatter RF data of selected ROIs in B-scan images. Each ROI had an axial length of 1 mm (i.e., 25 pulse lengths long) and a lateral length of 5 mm with 48 RF lines. Mean±standard error of the mean of the IBC are shown (n=5 samples per fabrication condition). A linear fit to the IBC estimates as a function of collagen concentration and corresponding regression coefficient R2 are shown.
<b>FIG. 7.</b>
FIG. 7.
Volumetric imaging of 3D collagen gels in tissue culture plates. Collagen hydrogels (2 mg/mL) were polymerized in 12-well tissue culture plates at 37°C for 1 h. The gels were 9 mm thick and 22 mm in diameter. Shown are representative (A) B-scan and (B) overlaid IBC parametric color images obtained beginning at one edge of the gel, with the transducer focused 4.5 mm below the surface of the gel. The IBC was estimated using the backscatter RF data of selected ROIs in B-scan images. Each color pixel represents an ROI with a lateral length of 850 μm (eight RF lines) and an axial length of 41 μm (one pulse length). Images shown represent one of 3 gels analyzed. Scale bar, 2 mm. Color images available online at www.liebertpub.com/tec
<b>FIG. 8.</b>
FIG. 8.
C-scan and IBC parametric imaging of collagen gels. Collagen (2 mg/mL) gels were fabricated in 12-well tissue culture plates in the absence (A, B) and presence (C, D) of cells. Gels were polymerized for 1 h at 37°C. The gels were 9 mm thick and 22 mm in diameter. C-scan images of the (A) acellular and (C) cell-embedded gels are shown. The ultrasound transducer was focused at the middle of each gel (axial depth of 4.5 mm). Each pixel in the IBC images (B, D) corresponds to a 3D ROI with nine RF lines (three RF lines laterally, three RF lines transaxially) of 1-mm axial length. Images shown represent one of 3 gels analyzed. Scale bar, 5 mm. Note the colorbar scale in the IBC image of cell-embedded gels (D) is an order of magnitude greater than that of acellular gels (B). Color images available online at www.liebertpub.com/tec
<b>FIG. 9.</b>
FIG. 9.
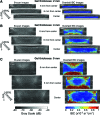
Imaging of three-dimensional (3D) collagen gels of different thickness. Collagen hydrogels (2 mg/mL) were polymerized in 12-well tissue culture plates at 37°C for 1 h. The gels were 22 mm in diameter with thickness of either (A) 2, (B) 4, or (C) 9 mm. Shown are representative B-scan and overlaid IBC parametric images obtained at the gel center, and at 6 and 8 mm from the gel center. B-scan images shown are focused at the middle region of the gel at axial depths of 1, 2, and 4 mm within the 2, 4, and 9-mm thick gels, respectively. The IBC was estimated using the backscattered RF data collected at multiple depths, spanning the thickness of the gel. Each color pixel in the IBC images corresponds to a ROI with a lateral length of 850 μm (eight RF lines) and an axial length of 41 μm (one pulse length). Images shown represent one of at least 3 gels analyzed for each gel thickness. Scale bar, 2 mm. Color images available online at www.liebertpub.com/tec
<b>FIG. 10.</b>
FIG. 10.
B-scan and IBC imaging of acellular and cell-embedded gels. Collagen (2 mg/mL) gels were fabricated in 12-well tissue culture plates in the absence and presence of cells. The gels were 9 mm thick and 22 mm in diameter. Shown are representative (A) B-scan and (B) overlaid IBC parametric images obtained at the gel center, and at 6 and 8 mm from the gel center. The IBC was estimated using the backscattered RF data collected at multiple depths, spanning the thickness of the gel. Each pixel in the IBC images (B) corresponds to an ROI with eight RF lines (850 μm laterally) of 1-mm axial length (25 pulse lengths). Images shown represent one of at least three gels analyzed. Scale bar, 4 mm. Note the colorbar scale in the IBC images of the cell-embedded gel is an order of magnitude higher than that of the acellular gel. Color images available online at www.liebertpub.com/tec

Similar articles

Cited by

References

    1. Miron-Mendoza M., Seemann J., and Grinnell F. The differential regulation of cell motile activity through matrix stiffness and porosity in three dimensional collagen matrices. Biomaterials 31, 6425, 2010 - PMC - PubMed
    1. Raub C.B., Suresh V., Krasieva T., Lyubovitsky J., Mih J.D., Putnam A.J., Tromberg B.J., and George S.C. Noninvasive assessment of collagen gel microstructure and mechanics using multiphoton microscopy. Biophys J 92, 2212, 2007 - PMC - PubMed
    1. Yang Y.L., Leone L.M., and Kaufman L.J. Elastic moduli of collagen gels can be predicted from two-dimensional confocal microscopy. Biophys J 97, 2051, 2009 - PMC - PubMed
    1. Achilli M., and Mantovani D. Tailoring mechanical properties of collagen-based scaffolds for vascular tissue engineering: the effects of ph, temperature and ionic strength on gelation. Polymers Basel 2, 664, 2010
    1. Sung K.E., Su G., Pehlke C., Trier S.M., Eliceiri K.W., Keely P.J., Friedl A., and Beebe D.J. Control of 3-dimensional collagen matrix polymerization for reproducible human mammary fibroblast cell culture in microfluidic devices. Biomaterials 30, 4833, 2009 - PMC - PubMed

Publication types

LinkOut - more resources