. 2014 Nov 20;41(5):830-42.
doi: 10.1016/j.immuni.2014.10.017. Epub 2014 Nov 5.

STING-dependent cytosolic DNA sensing mediates innate immune recognition of immunogenic tumors

Affiliations

STING-dependent cytosolic DNA sensing mediates innate immune recognition of immunogenic tumors

Seng-Ryong Woo et al. Immunity. .

Erratum in

  • Immunity. 2015 Jan 20;42(1):199

Abstract

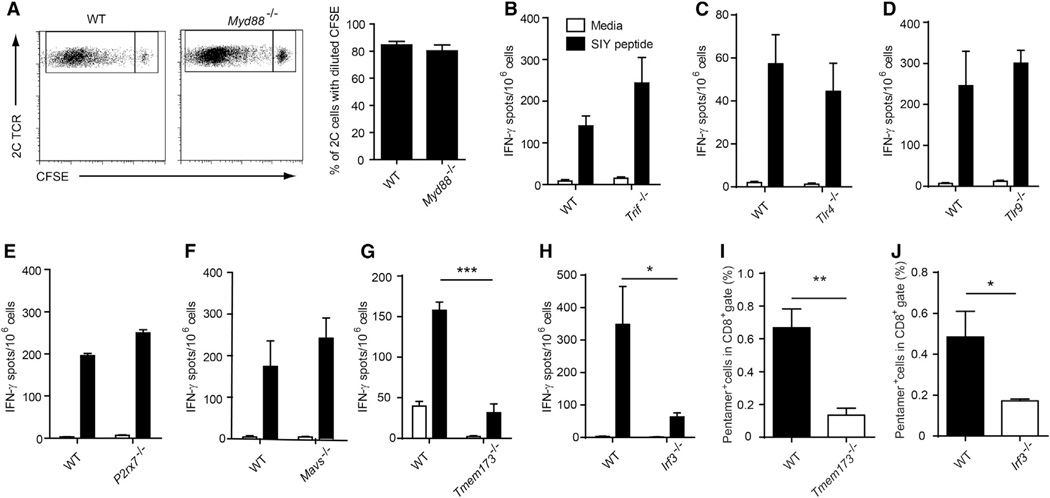
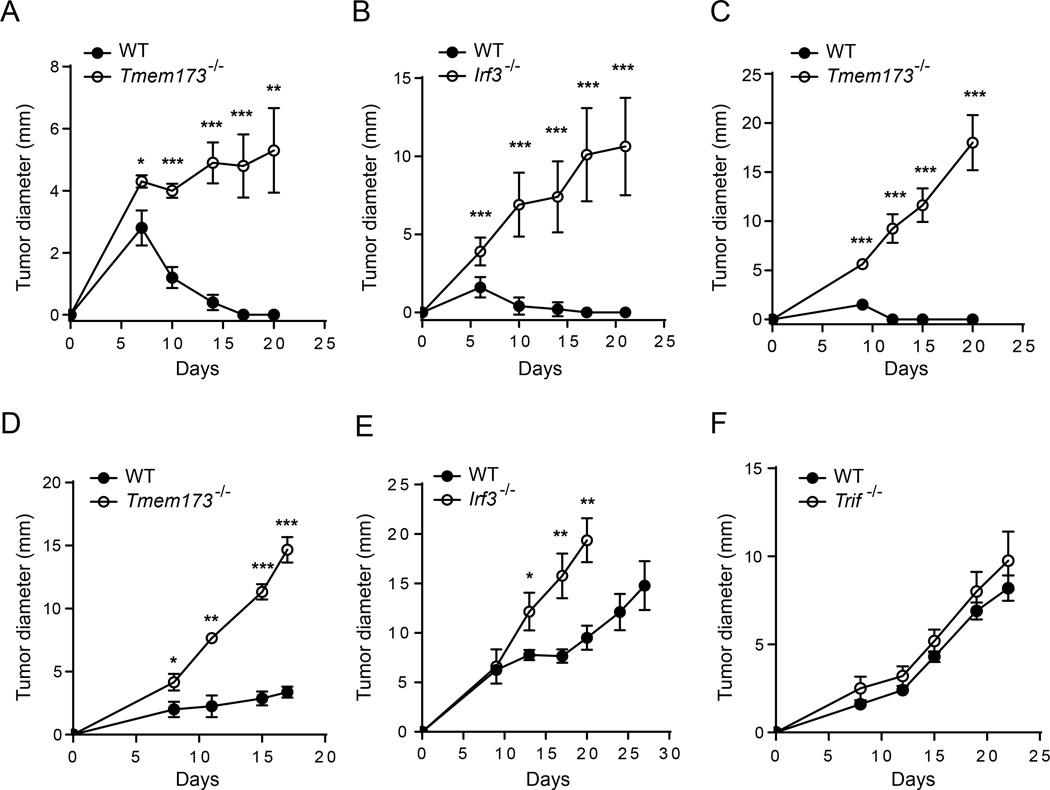
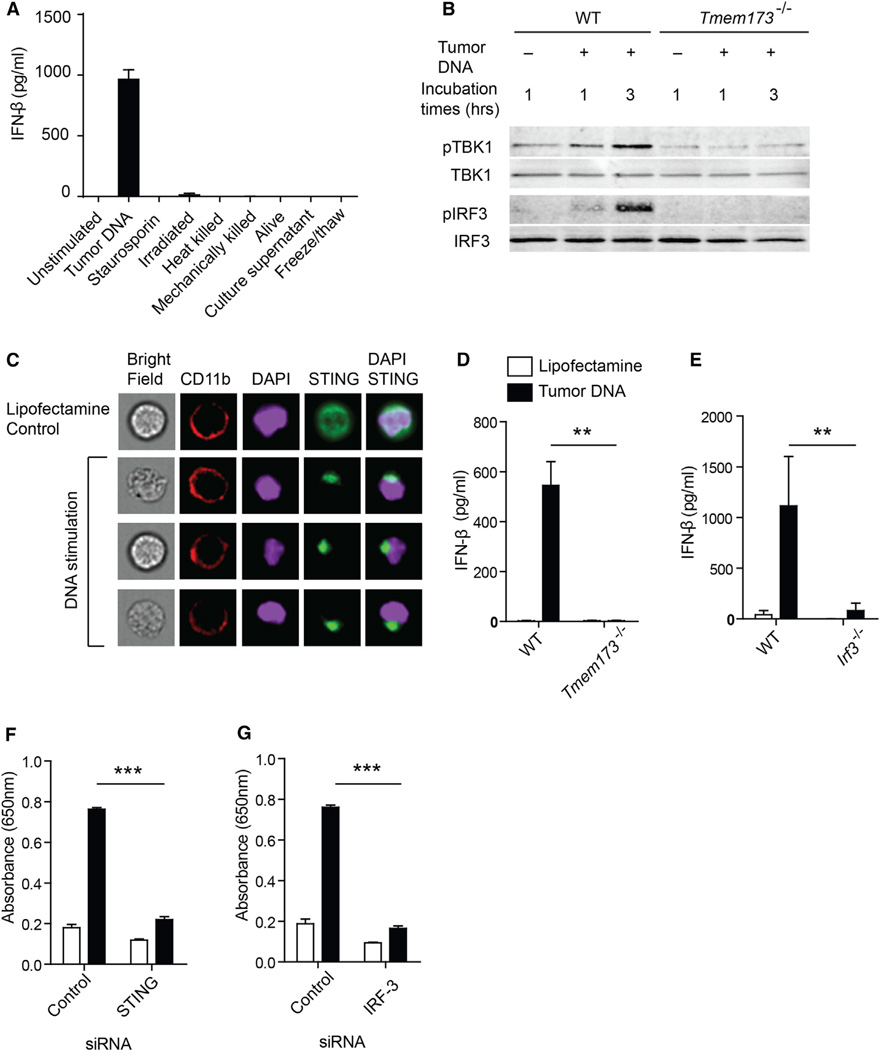
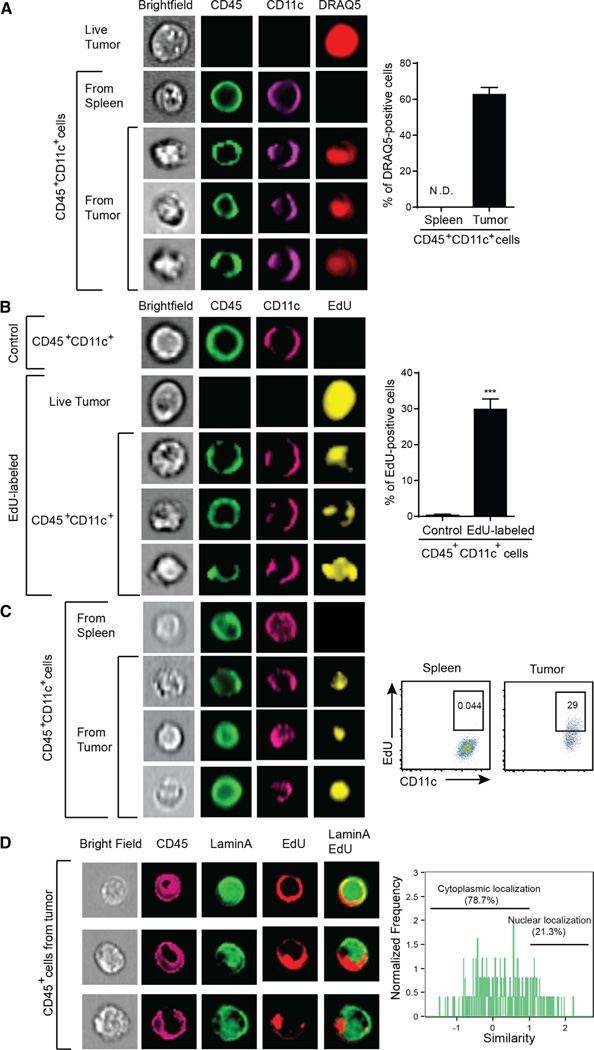
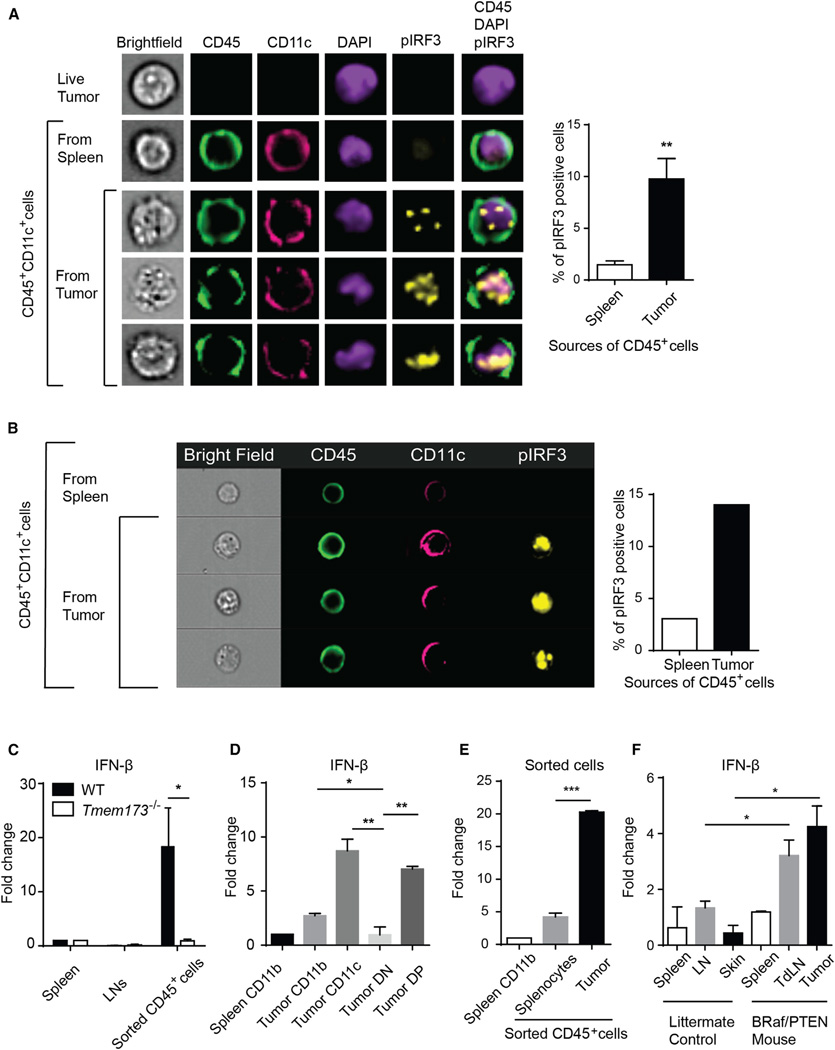
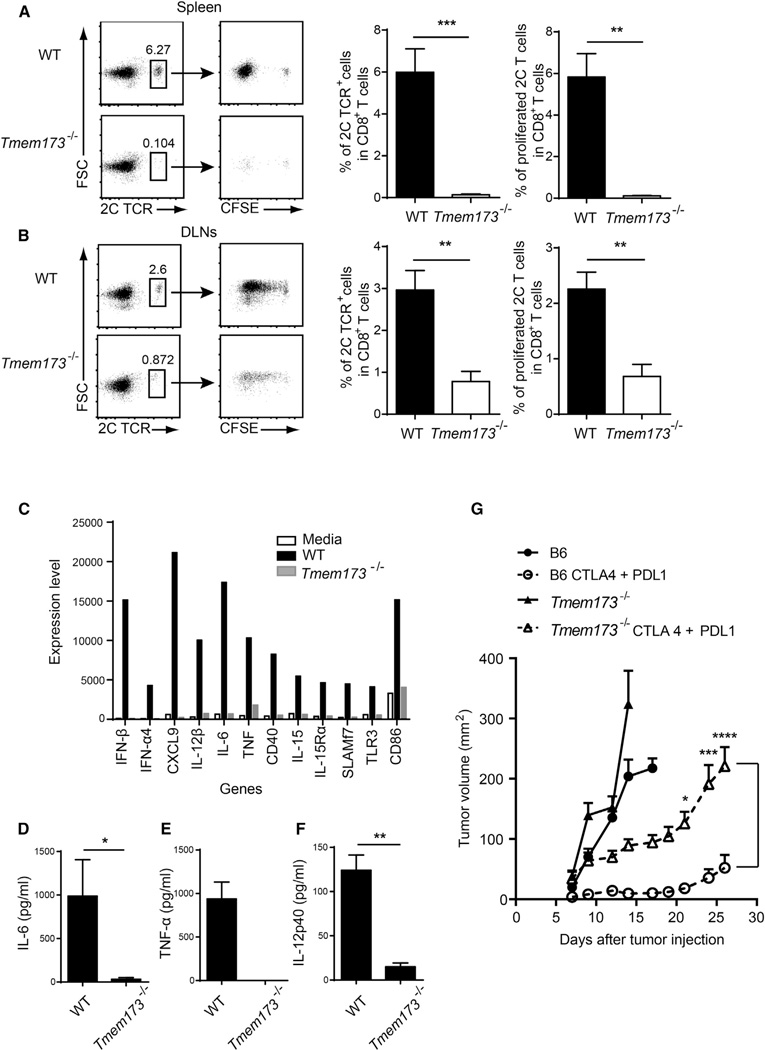
Spontaneous T cell responses against tumors occur frequently and have prognostic value in patients. The mechanism of innate immune sensing of immunogenic tumors leading to adaptive T cell responses remains undefined, although type I interferons (IFNs) are implicated in this process. We found that spontaneous CD8(+) T cell priming against tumors was defective in mice lacking stimulator of interferon genes complex (STING), but not other innate signaling pathways, suggesting involvement of a cytosolic DNA sensing pathway. In vitro, IFN-? production and dendritic cell activation were triggered by tumor-cell-derived DNA, via cyclic-GMP-AMP synthase (cGAS), STING, and interferon regulatory factor 3 (IRF3). In the tumor microenvironment in vivo, tumor cell DNA was detected within host antigen-presenting cells, which correlated with STING pathway activation and IFN-? production. Our results demonstrate that a major mechanism for innate immune sensing of cancer occurs via the host STING pathway, with major implications for cancer immunotherapy.


Figures

Figure 1
Figure 1. STING and IRF3 Are Required for CD8+ T Cell Priming In Vivo
(A) CFSE-labeled 2C T cell were transferred into WT (n = 6) or Myd88−/− (n = 6) mice and B16.SIY melanoma cells were inoculated 1 day later. After 6 days, mice were sacrificed and splenocytes were stained with anti-CD8 and the clonotypic mAb 1B2 and analyzed by flow cytometry for CFSE dilution. (B) Trif−/− (n = 5), (C) Tlr4−/− (n = 4), (D) Tlr9−/− (n = 5), (E) P2×7r−/− (n = 5), (F) Mavs−/− (n = 5), (G) Tmem173−/− (STING-deficient) (n = 5), (H) Irf3−/− (IRF3-deficient) (n = 5) mice were inoculated with 106 B16.SIY melanoma cells. After 7 days, splenocytes were analyzed for SlY-specific IFN-γ -producing CD8+ T cell frequencies by ELISPOT assay. (I and J) SIY peptide-specific pentamer staining was performed in Tmem173−/− (n = 5) and lrf3−/− (n = 5) mice, respectively. WT mice were used as controls. *p < 0.05, ***p < 0.001 (Student’s t test). Data represent mean ± SEM and are representative of two to three independent experiments. See also Figures S1 and S2.
Figure 2
Figure 2. Tmem173−/−Mice andIrf3−/−Mice Show Defective Tumor Control
(A and B) 1969 tumor cells were inoculated into WT, Tmem173−/−, or Irf3−/− mice and tumor growth was recorded on the indicated days. (C) WT or Tmem173−/− mice (129 background) were inoculated with 106 B16.SIY melanoma cells and tumor size was measured over time. (D–F) B16.SIY tumor cells (106 cells per mouse) were injected into the indicated mice subcutaneously, and tumor growth was measured on the indicated days. *p < 0.05, **p < 0.01, ***p < 0.001 (Student’s t test). Data represent mean ± SEM and representative of at least two independent experiments.
Figure 3
Figure 3. Tumor-Derived DNA Activates STING Pathway and Induces IFN-β via cGAS-, STING-, and IRF3-Dependent Mechanism
(A) Cultured B16 melanoma tumor cells were manipulated or used as a source of material as indicated, and incubated with BM-DCs for 18 hr. The amount of secreted IFN-β was measured by ELISA. (B) BM-DC cells from WT or Tmem173−/− mice were stimulated with 1 µg/ml of tumor-derived DNA for the indicated time points. The amount of pTBK1, total TBK1, plRF3, and total IRF3 was measured by immunoblot. (C) Asc−/− macrophages that overexpress STING-HA tag were stimulated with tumor-derived DNA for 1 hr and stained for CD11b, HA-tag, and DAPI. Single cell images were acquired using the ImageStream instrument and analyzed with IDEAS software. (D and E) BM-DCs were generated from WT, Tmem173−/−or lrf3−/− mice and stimulated with tumor DNA in the presence of Lipofectamine. The amount of IFN-β was measured by ELISA. (F and G) IFN-β reporter cells were transfected with siRNAs specific for STING or IRF3 followed by stimulation with tumor DNA. Reporter activity was measured as described in Experimental Procedures. *p<0.05, **p < 0.01, ***p< 0.001 (Student’s t test). Data represent mean ± SEM and representative of three independent experiments. See also Figure S3.
Figure 4
Figure 4. Tumor-Infiltrating Host APCs Uptake Tumor-Derived DNA In Vivo
(A) B16.SIY tumor cells were stained with DRAQ5, extensively washed, and then inoculated into mice subcutaneously. The next day, isolated single-cell suspensions were stained and single cell images were acquired using ImageStream. Acquired images were analyzed with IDEAS software. (B) B16.SIY tumor cells were labeled with EdU, extensively washed, and then inoculated into mice. The next day, tumor bumps were harvested and EdU staining was analyzed by ImageStream. Nonlabeled tumor cells were used as a negative control. (C) B16 melanoma cells were stained with EdU and injected into mice subcutaneously. At day 5, when tumors were becoming palpable, tumors were isolated including any infiltrating host cells and stained to exclude dead cells, along with anti-CD11 c, anti-CD45, and for EdU. Stained cells were acquired by ImageStream or flow cytometry and analyzed by IDEAS or FlowJo software. (D) At day 3 after injection of EdU-labeled B16 melanoma cells, tumor bumps were isolated and stained with anti-CD45, anti-Lamin A, and for EdU. Images of stained cells were acquired by Amnis ImageStream, and colocalization of EdU and Lamin A signals was analyzed using IDEAS software. ***p < 0.001 (Student’s t test). Data indicate mean ± SEM and representative of at least three (A, B, and C) or two (D) independent experiments. See also Figure S4.
Figure 5
Figure 5. Tumor-Infiltrating Host APCs Produce IFN-β via a STING-Dependent Fashion In Vivo
(A) B16.SIY tumor cells were inoculated into mice subcutaneously. The next day, tumor bumps were harvested and the suspended cells were fixed, per-meabilized, and stained with the indicated antibodies. Acquired images with ImageStream were analyzed using IDEAS software. (B) B16.SIY melanoma cells were injected into mice. After 1 week, tumors were harvested and host immune cells were isolated and stained with the indicated antibodies. Acquired images were analyzed by Amnis software (IDEAS). (C and D) B16.SIY tumor cells were inoculated into WT or Tmem173−/−mice. The next day, tumor cells, lymph nodes, and spleens were isolated as above and stained with anti-mouse CD45 antibody (C) and CD11 b and CD11 c (D) antibodies. Stained cell populations were isolated by cell sorting. Expression of IFN-β was measured by q-RT-PCR. CD11b+ or CD11c+ cells from lymph nodes or spleen were used as controls. (E) Splenocytes were isolated from CD45.1 mice and injected into CD45.2+ C57BL76 mice. After 1 day, associated infiltrating CD45.2+ cells were stained and sorted by flow cytometry for analysis of IFN-β transcript expression. B16 melanoma cells were used as a control with the same procedure. (F) CD45+ CD19 CD3 live cells were isolated from skin or tumor, LN and spleen of either healthy, nontamoxifen treated littermates or tamoxifen-treated Srafv600EPten−/− tumor-bearing mice using cell sorting. Expression of IFN-β transcript was measured by qPCR. *p = 0.05 (one-sided Mann-Whitney U test, n = 3 each samples) (F). *p < 0.05, **p < 0.01, ***p < 0.001 (Student’s t test). Data indicate mean ± SEM and representative of two (B and G) or three (A and C–F) independent experiments. See also Figures S5 and S6.
Figure 6
Figure 6. Tmem173−/−Mice Show Defective Accumulation of Antitumor T Cells
(A and B) CFSE-labeled 2CT cell were transferred into WT or Tmem 173−/− mice and B16.SIY melanoma cells were inoculated into recipient mice after 1 day. On day 6, mice were sacrificed and spleens and tumor-draining lymph nodes were removed. Cells were stained with anti-CD8 and the clonotypic mAb 1B2 and analyzed by flow cytometry for CFSE dilution. Data were analyzed by FlowJo software and quantitated as shown in the panels on the right. (C) BM-DCs from WT or Tmem173−/− mice were stimulated with tumor DNA for 7 hr and RNA was isolated. Isolated RNA was analyzed by Affymetrix GeneChip analysis. (D-F) BM-DCs from WT or Tmem173−/− mice were stimulated with tumor DNA and the indicated cytokines were measured by ELISA. (G) Mice were injected with 1 × 10⁶ B16-SIY cells on day 0. On day 4, combinatorial antibody therapy was initiated. Anti-CTLA-4 mAb (100 ng/mouse) was administered intraperitoneally on days 4,7, and 10, and anti-PD-L1 mAb (100 ng/mouse) was given every other day starting on day 4 and ending on day 16. Tumor growth was measured on the indicated days. Data represent mean ± SEM (n = 10, each group) of combined two independent experiments. Statistical significance was determined using two-way ANOVA test. *p < 0.05, **p< 0.01, ***p < 0.001, ****p < 0.0001 (Student’s t test or two-way ANOVA test). Data indicate mean ± SEM (n = 5) and representative of two (A and B) or three (C-F) independent experiments.

Comment in

References

    1. Abe T, Harashima A, Xia T, Konno H, Konno K, Morales A, Ahn J, Gutman D, Barber GN. STING recognition of cytoplasmic DNA instigates cellular defense. Mol. Cell. 2013;50:5–15. - PMC - PubMed
    1. Ahn J, Gutman D, Saijo S, Barber GN. STING manifests self DNA-dependent inflammatory disease. Proc. Natl. Acad. Sci. USA. 2012;109:19386–19391. - PMC - PubMed
    1. Apetoh L, Ghiringhelli F, Tesniere A, Obeid M, Ortiz C, Criollo A, Mignot G, Maiuri MC, Ullrich E, Saulnier P, et al. Toll-like receptor 4-dependent contribution of the immune system to anticancer chemotherapy and radiotherapy. Nat. Med. 2007;13:1050–1059. - PubMed
    1. Blank C, Brown I, Peterson AC, Spiotto M, Iwai Y, Honjo T, Gajewski TF. PD-L1/B7H-1 inhibits the effector phase of tumor rejection by T cell receptor (TCR) transgenic CD8+ T cells. Cancer Res. 2004;64:1140–1145. - PubMed
    1. Blank C, Brown I, Kacha AK, Markiewicz MA, Gajewski TF. ICAM-1 contributes to but is not essential for tumor antigen cross-priming and CD8+ T cell-mediated tumor rejection in vivo. J. Immunol. 2005;174:3416–3420. - PubMed

Publication types

MeSH terms

Associated data