. 2014 Nov 20;41(5):853-65.
doi: 10.1016/j.immuni.2014.11.001. Epub 2014 Nov 6.

Distinct epigenetic signatures delineate transcriptional programs during virus-specific CD8(+) T cell differentiation

Affiliations

Distinct epigenetic signatures delineate transcriptional programs during virus-specific CD8(+) T cell differentiation

Brendan E Russ et al. Immunity. .

Erratum in

  • Immunity. 2014 Dec 18;41(6):1064

Abstract

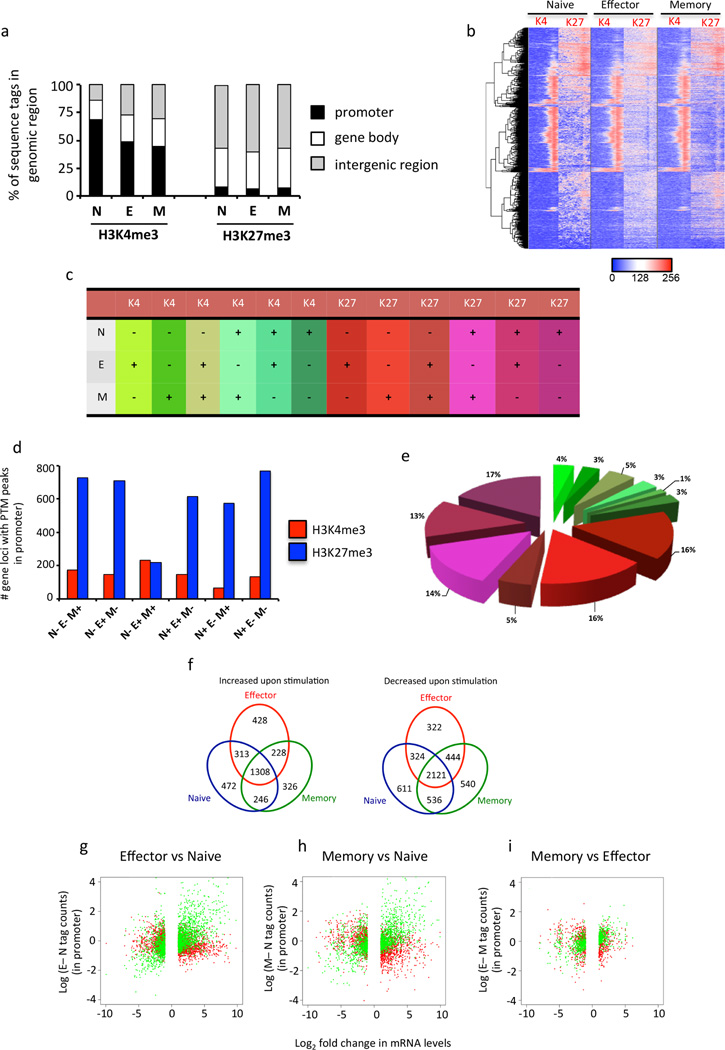
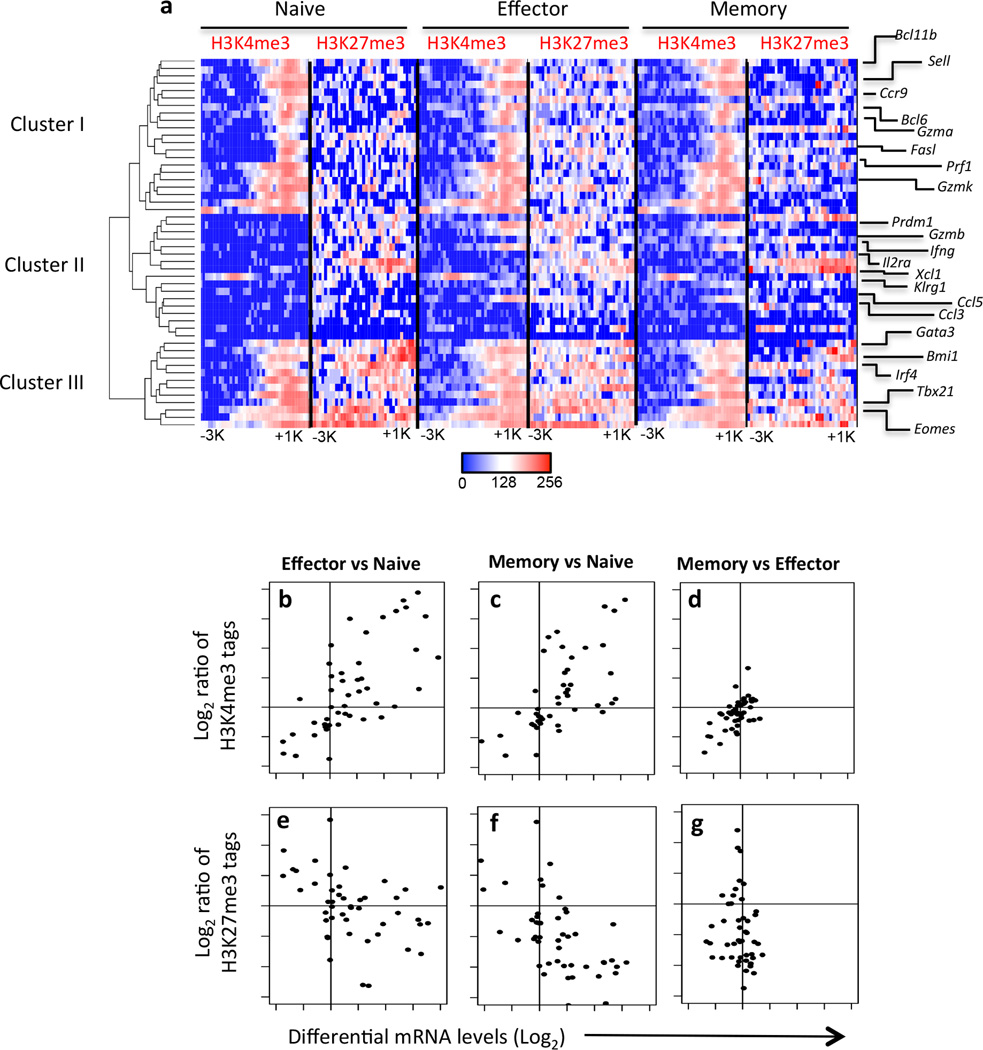
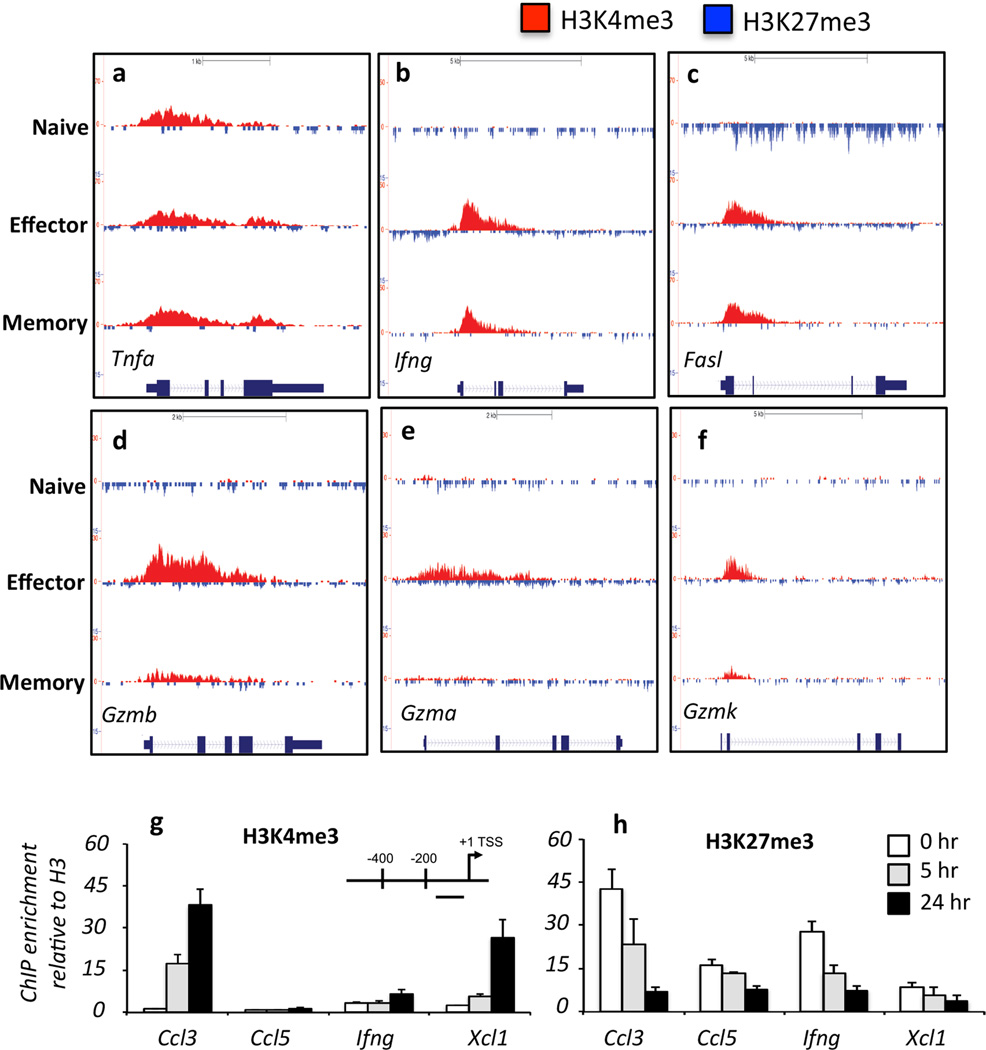
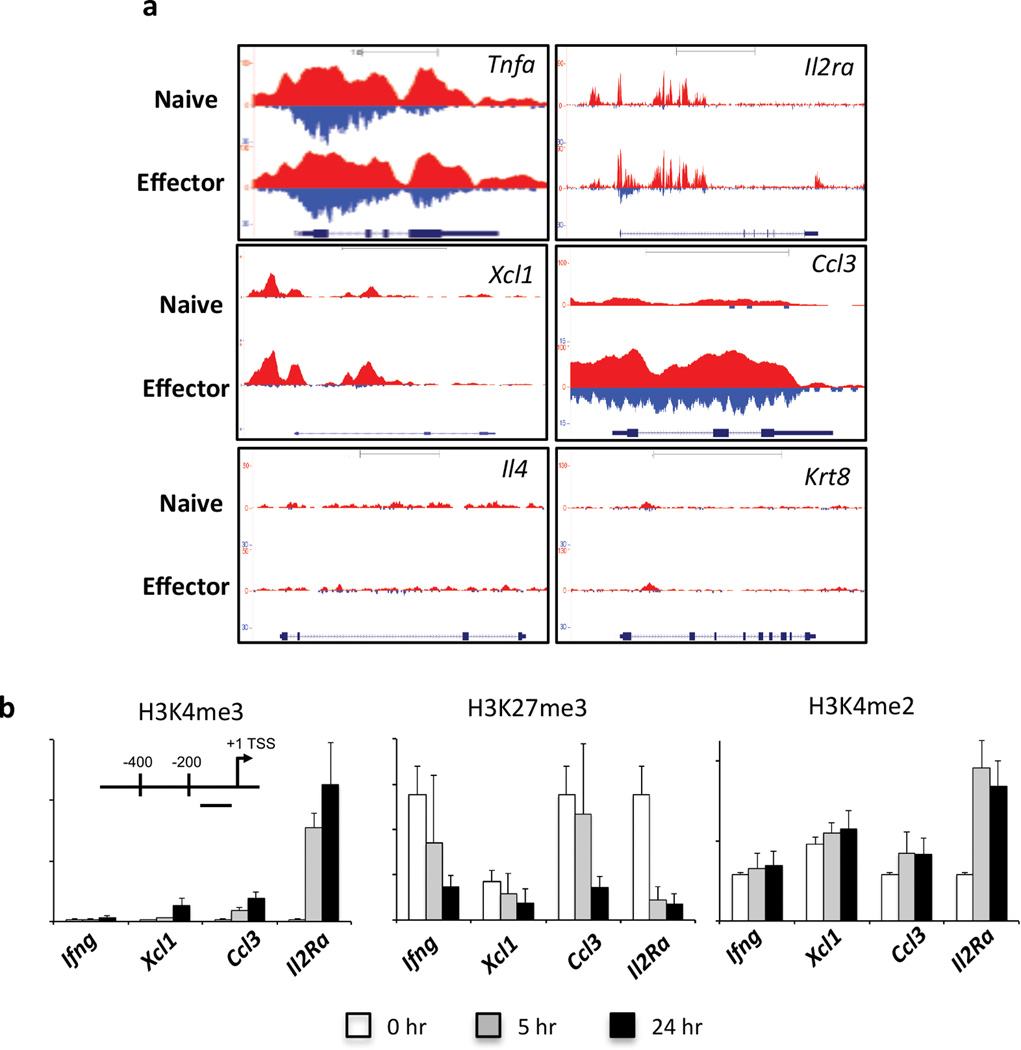
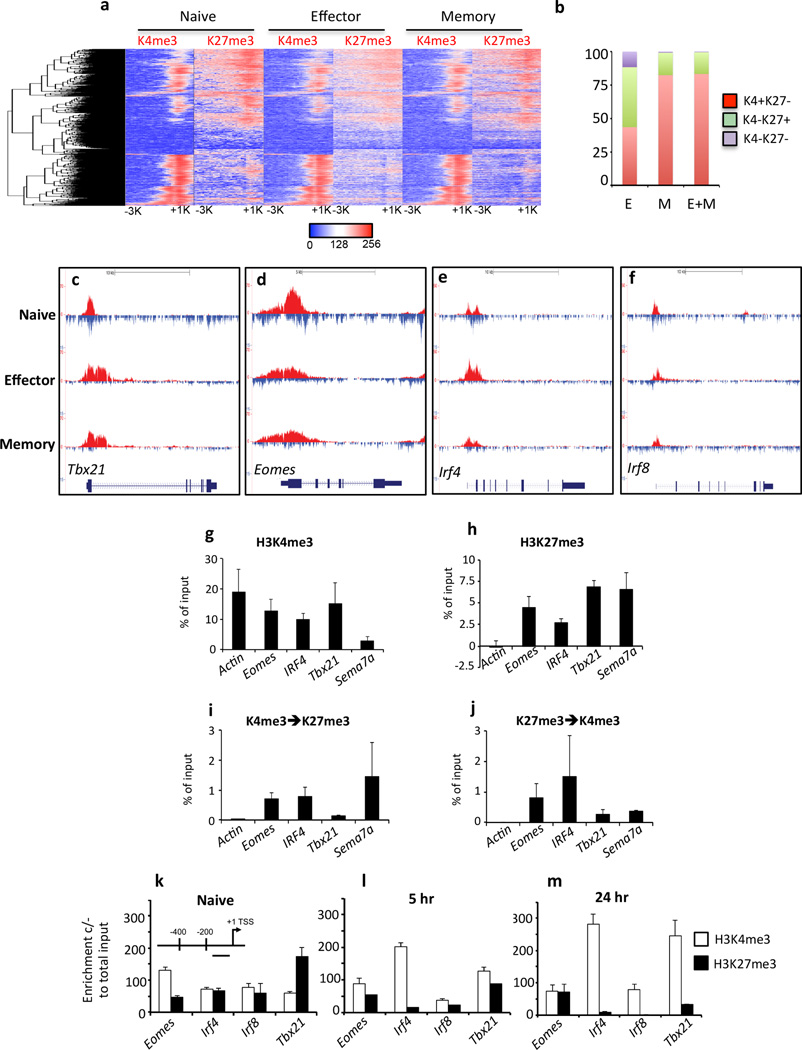
The molecular mechanisms that regulate the rapid transcriptional changes that occur during cytotoxic T lymphocyte (CTL) proliferation and differentiation in response to infection are poorly understood. We have utilized ChIP-seq to assess histone H3 methylation dynamics within naive, effector, and memory virus-specific T cells isolated directly ex vivo after influenza A virus infection. Our results show that within naive T cells, codeposition of the permissive H3K4me3 and repressive H3K27me3 modifications is a signature of gene loci associated with gene transcription, replication, and cellular differentiation. Upon differentiation into effector and/or memory CTLs, the majority of these gene loci lose repressive H3K27me3 while retaining the permissive H3K4me3 modification. In contrast, immune-related effector gene promoters within naive T cells lacked the permissive H3K4me3 modification, with acquisition of this modification occurring upon differentiation into effector/memory CTLs. Thus, coordinate transcriptional regulation of CTL genes with related functions is achieved via distinct epigenetic mechanisms.


Figures

Figure 1
Figure 1. Global histone methylation and transcriptional patterns of naïve, effector and memory OT-I CD8+ T cells
(f) Naïve (CD44loCD62Lhi) CD45.1+ CD8+ OT-I CTLs were sort purified prior to adoptive transfer into CD45.2+ congenic mice. Mice that had received naïve OT-Is were infected with A/HKx31-OVA and effector (CD44hiCD62Llo), and memory (CD44hi) OT-Is were isolated and sort purified either 10 or 60 days after infection, respectively. (a–e) ChIP-seq using an Illumina HiSeq2000 was performed on naïve, effector and memory CD8+ OT-I T cells for both H3K4me3 and H3K27me3 histone PTMs. Data were mapped back to the mouse genome (version mm10). (a) Shown is the proportion of H3K4me3 or H3K27me3 sequence tags that mapped to promoter regions (−3 kb/+1 kb around the TSS, black bars), the gene body (+1kb TSS to 3’UTR, white bars) or intergenic regions (grey bars). (b) Gene promoters that exhibited differences in H3K4me3 or H3K27me3 enrichment were identified and the data transformed (log2) and converted into a heatmap (described in methods). Hierarchical clustering was then used to determine the relationship of histone methylation patterns observed in the promoter region between naïve, effector and memory CTL subsets. (c–e) The number of gene loci that exhibited differences in histone methylation patterns (c) within the promoter region was determined as described in the methods. Shown is the number (d) of genes and proportion (e) that exhibited distinct patterns of H3K4me3 (blue) or H3K27me3 (red) peaks between naïve, effector and memory OT-Is. Shown is the number of gene loci that exhibited specific patterns of H3K4me3 or H3K27me3 deposition between naïve, effector and memory OT-Is. (f) RNA-seq was performed on an Illumina HiSeq2000 and the reads mapped back to exons on the mouse genome (version mm10) to determine the transcriptional profiles of naïve, effector and memory CD8+ CD45.1+ OT-I before and after 5 hrs of OVA257 peptide stimulation. The number of differentially expressed (DE, log2>1.7) genes that were either upregulated or down-regulated were identified for naïve (blue), effector (red) and memory (green) CTL subsets. (g–i) The difference in H3K4me3 (green) or H3K27me3 (red) sequence tag density was determined for promoters identified with distinct patterns of peak enrichment (d, e) for effector vs naïve (g), memory vs naïve (h) and memory vs effector (i) CTL subsets. This was then correlated against the log2FC of DE gene expression between the same groups (effector vs naïve (g), memory vs naïve (h) and memory vs effector (i)).
Figure 2
Figure 2. Histone methylation patterns identify gene cohorts with distinct functional roles during CTL differentiation
(a) The number of H3K4me3 or H3K27me3 sequences tags within −3 kg/+1 kb around the TSS for genes known to have roles in CTL differentiation (listed in Supplementary Table 2) was transformed (log2) and converted into a heatmap (described in methods). Hierarchical clustering was then used to determine the relationship of histone methylation patterns observed in the promoter regions between the listed genes. Shown is the list order of genes after clustering. (b–g) The ratio of sequence tags for H3K4me3 (panels b–d) or H3K27me3 (panels e–g) were correlated with the log2 fold change in transcriptional mRNA levels between naiive, effector and memory CTL subsets as described in Figure 1 for listed the gene listed in Supplementary Table 2.
Figure 3
Figure 3
(a–f) Shown is the pattern of H3K4me3 (red, above line) and H3K27me3 (blue, below line) peaks within the promoter, gene body and 3’UTR regions of CTL effector gene loci within naïve, effector and memory OT-Is. (g, h) ChIP for either H3K4me3 or H3K27me3 was performed on naïve OT-Is (white bars), or OT-Is stimulated with OVA257 peptide for 5 (grey bars) or 24 (black bars) hours. Enrichment for H3K4me3 or H3K27me3 was determined by Q-PCR, using primers that targeted the proximal promoter just upstream of the TSS (inset) of the specific gene loci.
Figure 4
Figure 4. H3K4me2 marks a subset of rapidly transcribed effector gene loci in naïve CTLs
(a) Shown are the patterns of H3K4me2 (red, above line) and H3K4me3 (blue, below line) peaks within the promoter, gene body and 3’UTR of genes within naïve and effector OT-Is. (b) ChIP for either H3K4me3, H3K27me3 and H3K4me2 was performed on naïve OT-Is (white bars), or OT-Is stimulated with OVA257 peptide for 5 (grey bars) or 24 (black bars) hrs. Enrichment for H3K4me3, H3K27me3 or H3K4me2 was determined by Q-PCR, using primers that targeted the proximal promoter just upstream of the TSS (inset) of the specific genes.
Figure 5
Figure 5. Bivalent loci within naïve CTLs rapidly resolve to a permissive H3K4me3+/H3K27me3-methylation signature
(a) Bivalent loci were identified in naïve OT-I as having overlapping H3K4me3/H3K27me3 peaks within 400 bp of each other. Clustering analysis, based on log2 enrichment levels of histone methylation patterns within the promoter region was performed to generate a hierarchical list and the histone methylation patterns in effector and memory OT-I determined. (b) Methylation patterns of genes that were bivalent in naïve cells were determined in effector and memory CTL populations. Shown is the proportion of genes that lost H3K27me3 (K4+/K27-, red); lost H3K4me3 (K4−/K27+, green); or lost both methylation marks (K4−/K27−, puple) in effector (E), memory (M) or both effector and memory (E+M) subsets (c–f) Shown is the pattern of H3K4me3 (red, above line) and H3K27me3 (blue, below line) enrichment within the promoter, gene body and 3’UTR of bivalent genes within naïve, effector and memory OT-Is. (g–j) Sequential ChIP was performed on sort purified naïve (CD44loCD62Lhi) OTI by first immunoprecipitation with antibodies specific for H3K4me3 (g) or H3K27me3 (h) with samples probed for enrichment by RT-PCR using primers that targeted a 400 bp region just upstream of the TSS. These samples were then immunoprecipitated a second time with antibodies specific for either H3K27me3 (i) or H3K4me3 (j) and samples probed for enrichment as above. (k–m) ChIP for either H3K4me3 (white bars) or H3K27me3 (black bars) was performed on naïve OT-Is (k), or OT-Is stimulated with OVA257 peptide for 5 (l) or 24 (m) hrs. Enrichment for H3K4me3 or H3K27me3 was determined by Q-PCR, using primers that targeted the proximal promoter just upstream of the TSS (inset).

References

    1. Allan RS, Zueva E, Cammas F, Schreiber HA, Masson V, Belz GT, Roche D, Maison C, Quivy JP, Almouzni G, Amigorena S. An epigenetic silencing pathway controlling T helper 2 cell lineage commitment. Nature. 2012;487:249–253. - PubMed
    1. Ansel KM, Lee DU, Rao A. An epigenetic view of helper T cell differentiation. Nat Immunol. 2003;4:616–623. - PubMed
    1. Araki Y, Fann M, Wersto R, Weng NP. Histone acetylation facilitates rapid and robust memory CD8 T cell response through differential expression of effector molecules (eomesodermin and its targets: perforin and granzyme B) J Immunol. 2008;180:8102–8108. - PMC - PubMed
    1. Araki Y, Wang Z, Zang C, Wood WH, 3rd, Schones D, Cui K, Roh TY, Lhotsky B, Wersto RP, Peng W, et al. Genome-wide analysis of histone methylation reveals chromatin state-based regulation of gene transcription and function of memory CD8+ T cells. Immunity. 2009;30:912–925. - PMC - PubMed
    1. Bernstein BE, Mikkelsen TS, Xie X, Kamal M, Huebert DJ, Cuff J, Fry B, Meissner A, Wernig M, Plath K, et al. A bivalent chromatin structure marks key developmental genes in embryonic stem cells. Cell. 2006;125:315–326. - PubMed

Publication types

MeSH terms