. 2014 Dec 17:13:170.
doi: 10.1186/1475-925X-13-170.

Real-time estimation of respiratory rate from a photoplethysmogram using an adaptive lattice notch filter

Affiliations

Real-time estimation of respiratory rate from a photoplethysmogram using an adaptive lattice notch filter

Chanki Park et al. Biomed Eng Online. .

Abstract

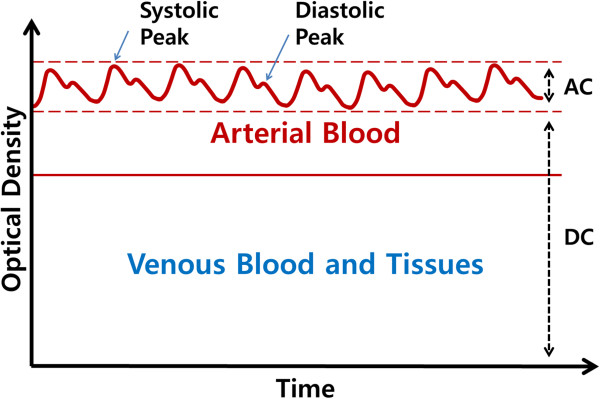
Background: Many researchers have attempted to acquire respiratory rate (RR) information from a photoplethysmogram (PPG) because respiration affects the waveform of the PPG. However, most of these methods were difficult to operate in real-time because of their complexity or computational requirements. From these needs, we attempted to develop a method to estimate RR from a PPG with a light computational burden.

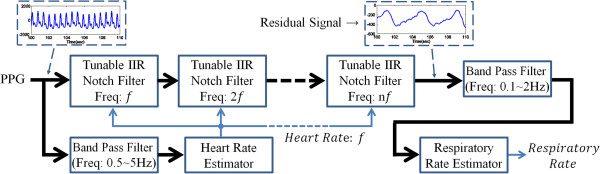
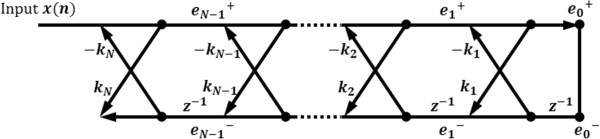
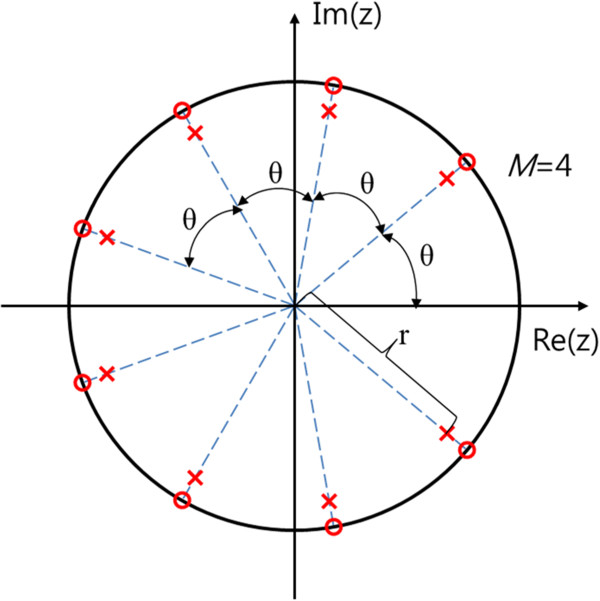
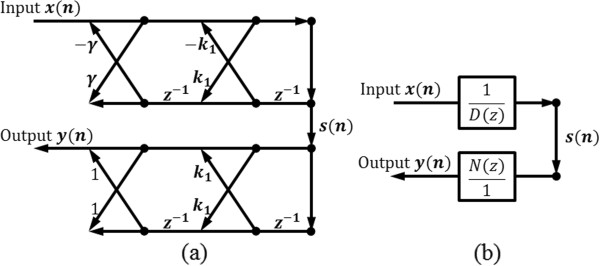
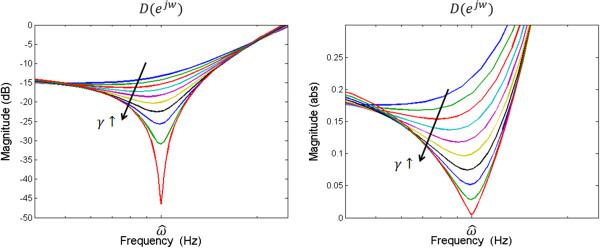
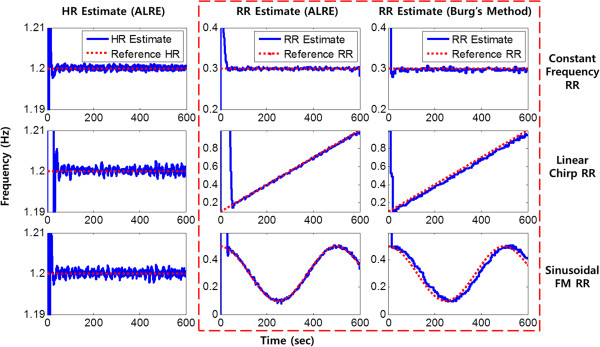
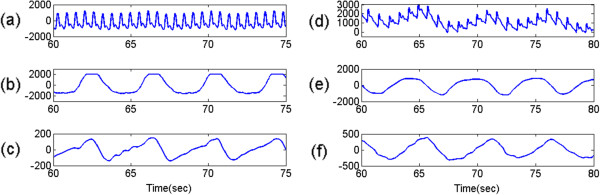
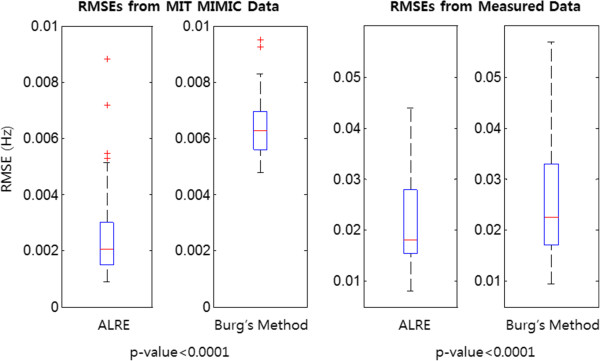
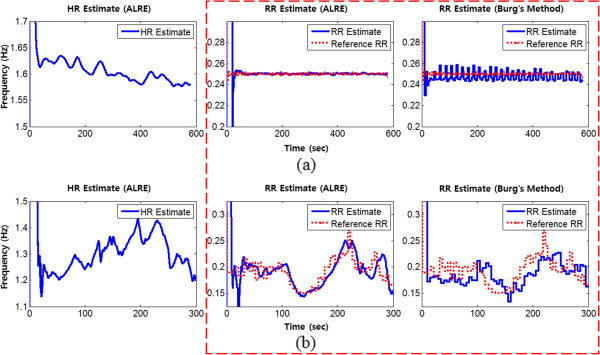
Methods: To obtain RR information, we adopt a sequential filtering structure and frequency estimation technique, which extracts a dominant frequency from a given signal. In particular, we used an adaptive lattice notch filter (ALNF) to estimate RR from a PPG along with an additional heart rate that is utilized as an adaptation parameter of our method. Furthermore, we designed a sequential infinite impulse response (IIR) notch filtering system (i.e., harmonic IIR notch filter) to eliminate the cardiac component and its harmonics from the PPG. We compared the proposed method with Burg's AR modeling method, which is widely used to estimate RR from a PPG, using open-source data and measured data.

Results: By using a statistical test, it was determined that our adaptive lattice-type respiratory rate estimator (ALRE) was significantly more accurate than Burg's AR model method (p <0.0001). Furthermore, the ALRE's tracking performance was better than that of Burg's method, and the variances of its estimates were smaller than those of Burg's method.

Conclusions: In short, our method showed a better performance than Burg's AR modeling method for real-time applications.


Figures

Figure 1
Figure 1
Composition of PPG. PPG wave is generated by fluctuating volume of arterial blood.
Figure 2
Figure 2
Overall system. The ALRE is constructed by two frequency estimators and harmonic IIR notch filter.
Figure 3
Figure 3
All-pole lattice filter for Burg’s method. e j + means j-th forward prediction error and e j is j-th backward prediction error.
Figure 4
Figure 4
An example of the pole-zero map of harmonic IIR notch filter with 4 harmonic components.
Figure 5
Figure 5
IIR lattice notch filter structure for ALNF. Upper part means all-pole filter and lower part is all-zero filter. (a): signal flow graph representation, (b): block diagram representation. D(z) and N(z) represent denominator and numerator of transfer function of IIR lattice notch filter, respectively.
Figure 6
Figure 6
Frequency response for the inverse of all-pole filter part of the IIR lattice notch filter. Vertical axis unit of left-side is dB and that of right-side is absolute value.
Figure 7
Figure 7
Simulation signal. (a): PPG with white Gaussian noise (20 dB), (b): reference respiratory signal (constant frequency).
Figure 8
Figure 8
RR tracking from simulated PPG. Solid lines represent estimates and dotted lines are reference values when all input signal’s SNRs are 10 dB. Dashed red box includes only RR estimation results for the ALRE and Burg’s method.
Figure 9
Figure 9
Experiment data. (a) and (b) represent PPG and the reference respiratory signal from MIT MIMIC data, respectively. (d) and (e) are PPG and the reference respiratory signal measured by BIOPAC® device. (c) and (f) depict residual signals obtained by the ALRE approach from MIT MIMIC data and measured signal, respectively. The unit of vertical axis is mV.
Figure 10
Figure 10
Distribution of RMSEs of RR estimation. Upper and lower boxes represent the distribution of RMSE from 25th to 75th percentiles. Center, top, and bottom line indicate 50th, 90th, and 10th percentiles. Left two columns means RMSEs (the ALRE’s and Burg’s method’s) from MIT MIMIC data, and right two columns represent RMSEs (the ALRE’s and Burg’s method’s) from experiment data measured by BIOPAC® device. P-values of paired t-test for MIT open source data and Wilcoxon signed rank test for measured data are less than 0.0001.
Figure 11
Figure 11
RR tracking from real data. (a): HR and RR tracking from MIT MIMIC data, (b): HR and RR tracking from measured data. Solid lines represent HR and RR estimates and dotted lines are reference RR values. Dashed red box includes only RR estimation results for the ALRE and Burg’s method.

References

    1. Asada HH, Shaltis P, Reisner A, Hutchinson RC. Mobile monitoring with wearable photoplethysmographic biosensors. IEEE Eng Med Biol Mag. 2003;22:28–40. doi: 10.1109/MEMB.2003.1213624. - DOI - PubMed
    1. Karlen W, Raman S, Ansermino JM, Dumont GA. Multiparameter respiratory rate estimation from the photoplethysmogram. IEEE Trans Biomed Eng. 2013;60:1946–1953. doi: 10.1109/TBME.2013.2246160. - DOI - PubMed
    1. Cejnar M, Kobler H, Hunyor SN. Quantitative photoplethysmography: Lambert-Beer law or inverse function incorporating light scatter. J Biomed Eng. 1993;15:151–154. doi: 10.1016/0141-5425(93)90047-3. - DOI - PubMed
    1. Dorlas JC, Nijboer JA. Photo-electric plethysmography as a monitoring device in anaesthesia. Br J Anaesth. 1985;57:524–530. doi: 10.1093/bja/57.5.524. - DOI - PubMed
    1. Addison PS, Watson JN, Mestek ML, Mecca RS. Developing an algorithm for pulse oximetry derived respiratory rate (RR(oxi)): a healthy volunteer study. J Clin Monit Comput. 2012;26:45–51. doi: 10.1007/s10877-011-9332-y. - DOI - PMC - PubMed

Publication types