

Cytoskeletal forces during signaling activation in Jurkat T-cells
- PMID: 25518938
- PMCID: PMC4325839
- DOI: 10.1091/mbc.E14-03-0830
Cytoskeletal forces during signaling activation in Jurkat T-cells
Abstract
T-cells are critical for the adaptive immune response in the body. The binding of the T-cell receptor (TCR) with antigen on the surface of antigen-presenting cells leads to cell spreading and signaling activation. The underlying mechanism of signaling activation is not completely understood. Although cytoskeletal forces have been implicated in this process, the contribution of different cytoskeletal components and their spatial organization are unknown. Here we use traction force microscopy to measure the forces exerted by Jurkat T-cells during TCR activation. Perturbation experiments reveal that these forces are largely due to actin assembly and dynamics, with myosin contractility contributing to the development of force but not its maintenance. We find that Jurkat T-cells are mechanosensitive, with cytoskeletal forces and signaling dynamics both sensitive to the stiffness of the substrate. Our results delineate the cytoskeletal contributions to interfacial forces exerted by T-cells during activation.
© 2015 Hui et al. This article is distributed by The American Society for Cell Biology under license from the author(s). Two months after publication it is available to the public under an Attribution–Noncommercial–Share Alike 3.0 Unported Creative Commons License (http://creativecommons.org/licenses/by-nc-sa/3.0).
Figures
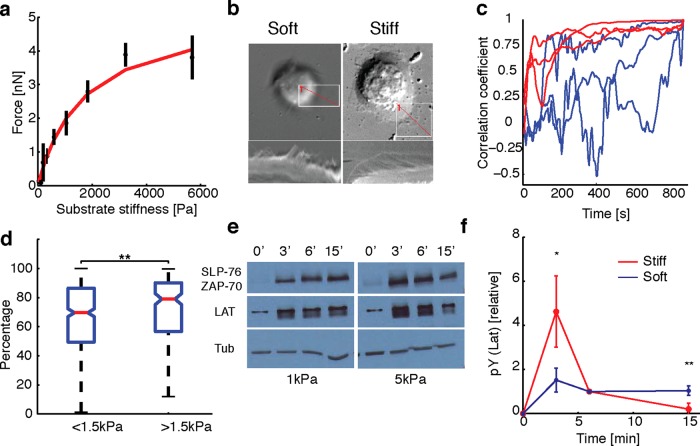
 (red curve) with Fsat = 5 nN, and kcell = 1 nN/μm (corresponding to 1.5 kPa). (b) Top, DIC images of two representative cells spreading on soft (200 Pa) and stiff (10 kPa) gels. Kymographs of edge dynamics for the two cells along the locations indicated by the red lines. (c) Example time traces of Pearson coefficient between cell edge's radial position profile at 15 min and at earlier time points for cells spreading on soft (blue) and stiff (red) gels. (d) Comparison of the percentage of time for which the cell edge profile had correlation coefficient >0.5 compared with the profile at 15 min for softer (<1.5 kPa stiffness) and stiffer (>1.5 kPa stiffness) gels. The difference between the two conditions is significant (t test, p < 0.001) and indicates that cell edges are more dynamic on softer gels. (e) Western blot analysis of tyrosine phosphorylation (pY) levels (of LAT and ZAP70/SLAP76 substrates) at the indicated times on two different gel stiffnesses (∼1 and ∼5 kPa). (f) Densitometry analysis of relative pY levels (for LAT substrate) as a function of time for cells on soft gels (blue curve, ∼1 kPa) and stiff gels (red curve, ∼ 5 kPa). Analysis represents average of five different experiments.
References
-
- Alon R, Dustin ML. Force as a facilitator of integrin conformational changes during leukocyte arrest on blood vessels and antigen-presenting cells. Immunity. 2007;26:17–27. - PubMed
Publication types
MeSH terms
Substances
Grants and funding
LinkOut - more resources
Full Text Sources
Molecular Biology Databases
