. 2014 Dec 18;516(7531):349-54.
doi: 10.1038/nature13921.

An AUTS2-Polycomb complex activates gene expression in the CNS

Affiliations

An AUTS2-Polycomb complex activates gene expression in the CNS

Zhonghua Gao et al. Nature. .

Abstract

Naturally occurring variations of Polycomb repressive complex 1 (PRC1) comprise a core assembly of Polycomb group proteins and additional factors that include, surprisingly, autism susceptibility candidate 2 (AUTS2). Although AUTS2 is often disrupted in patients with neuronal disorders, the mechanism underlying the pathogenesis is unclear. We investigated the role of AUTS2 as part of a previously identified PRC1 complex (PRC1-AUTS2), and in the context of neurodevelopment. In contrast to the canonical role of PRC1 in gene repression, PRC1-AUTS2 activates transcription. Biochemical studies demonstrate that the CK2 component of PRC1-AUTS2 neutralizes PRC1 repressive activity, whereas AUTS2-mediated recruitment of P300 leads to gene activation. Chromatin immunoprecipitation followed by sequencing (ChIP-seq) demonstrated that AUTS2 regulates neuronal gene expression through promoter association. Conditional targeting of Auts2 in the mouse central nervous system (CNS) leads to various developmental defects. These findings reveal a natural means of subverting PRC1 activity, linking key epigenetic modulators with neuronal functions and diseases.


Figures
Extended Data Figure 1
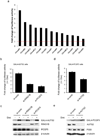
Requirement of the integrity of the PRC1-AUTS2 complex for transcriptional activation. a Luciferase activity in screened stable cell clones expressing GAl4-PCGF5, 24 hr after induction by doxycycline at 100 µg/ml. b Fold change in luciferase activity in GAl4-AUTS2 cells upon knockdown of RING1B or PCGF5. Cells were transfected with Lipofectamine 2000 RNAiMAX and siRNAs against RING1B or PCGF5, or control siRNAs for two days and then 100 µg/ml doxycycline was added to induce GAL4-AUTS2 expression. After 24 hr after induction luciferase activity was measured. Each value is the mean of three independent measurements. Error bars represent standard error. c Immunoblotting of samples used for luciferase activity reporter assay as in b using the antibodies indicated. d Fold change in luciferase activity in GAl4-PCGF5 cells upon knockdown of AUTS2. Cells were treated as in b. e Immunoblotting of samples used for luciferase activity reporter assay as in d using the antibodies indicated.
Extended Data Figure 2
H2A monoubiquitination assay and CK2 kinase assay performed with γ-32P-ATP. a Coomassie blue staining of factors used. b Scheme for H2A monoubiquitination assay with E1 that was pre-charged with HA-ubiquitin (See Methods for details). c Immunoblotting of H2A monoubiquitination assay as describe in b with increasing amounts of CK2. d Radiograph of CK2 kinase assay reaction products. The assay was assembled with the factors indicated, each at the same amount used in the H2A monoubiquitination assay (Methods). After incubation at 37°C for 30 min, the assay was stopped by boiling in SDS loading buffer and resolved on SDS-PAGE. Besides CK2B, which was radio-labeled presumably due to autophosphorylation, phosphorylation of RING1B and PCGF5 was detected together with a species, indicated as *histone, dependent on the presence of nucleosomes. e H2A monoubquitination assay performed as in Fig. 3c, using increasing amounts of RING1B-PCGF5-AUTS2 containing either RING1B-S41A (S41 to alanine), or RING1B-S41D (S41 to aspartic acid), purified from sf9 cells.
Extended Data Figure 3
Interaction of AUTS2 and P300. a IP from NE of 293 cells expressing NFH-AUTS2 using AUTS2 antibody, followed by Western blotting for the antigens indicated. b IP using recombinant proteins of P300 and AUTS2 purified from Sf9 cells and a P300 antibody, followed by FLAG or HA Western blotting.
Extended Data Figure 4
Luciferase activity without normalization using data from Fig. 4b and c.
Extended Data Figure 5
Expression of AUTS2 in mouse brain. a Validation of AUTS2 antibody by IHC in NFH-AUTS2 stable cells. Upon doxycycline induction, a stronger nuclear staining was detected compared with non-induction control, confirming the antibody we raised is suitable for IHC. b Detection of AUTS2 protein in a mouse embryo at E15 by immunohistochemistry (IHC) with AUTS2 antibody. c IHC analysis of a sagittal brain section from an adult mouse using AUTS2 antibody. d Expression of AUTS2 in the mouse brain. Immunoblotting was performed with whole brain extracts at various developmental stages as indicated. e Immunofluorescence staining of AUTS2 in P3 mouse brain. AUTS2 expression is confined to neurons (top panels) as seen by colocalization with the neuronal marker NeuN in the cortex and hippocampus. AUTS2 does not colocalize with the glial marker GFAP (bottom panels) in the same regions.
Extended Data Figure 6
Genome-wide analysis of AUTS2 ChIP-seq signals. a HOMER was used to compute the genomic distribution of AUTS2 peaks obtained from AUTS2 ChIP-seq in mouse brain. b Histogram of the distribution of AUTS2 peaks relative to TSS, calculated via HOMER. c Percentage of AUTS2 target genes overlapped with highest (top 25%, red bar) and lowest (bottom 25%, green bar) expression levels of all genes in mouse brain. d Percentage of overlapped peaks between two biological replicates of AUTS2 ChIP-seq in mouse brain.
Extended Data Figure 7
P300 is localized to AUTS2 targeted loci in mouse brain. a IGV browser views for input, P300, AUTS2, Pol II, H3K27ac, H3K4me3, H3K36me3, H3K27me3, and H2AK119ub1 ChIP-seq performed in P1 mouse brain at two representative loci. The y axis corresponds to ChIP-seq signal intensity. Gene representation at each locus is shown at the bottom. b ChIP reads density plots for levels of P300 at loci co-targeted by AUTS2/RING1B and BMI1/RING1B. A ±1 kb window relative to the center of peaks is shown.
Extended Data Figure 8
ChIP-seqs in 293 T-REx cells. a IGV browser views for input, HA-AUTS2, HA-RING1B, PolII, H3K27ac, H3K4me3, H3K36me3, HA-CBX2, and H3K27me3 ChIP-seq libraries at two representative loci. The y axis corresponds to the ChIP-seq signal intensity. Gene representation at each locus is shown at the bottom. ChIP-seq data for HA-RING1B, HA-CBX2, and H3K27me3 obtained from a previous study. b Genomic distribution of HA-AUTS2 target regions relative to TSS. The x axis corresponds to the distance from TSS (−20 kb to +20 kb); the y axis corresponds to frequency. c-e Venn diagrams showing the overlap among regions targeted by factors as indicated. f Analysis of mRNA levels of top targets identified by HA-AUTS2 ChIP-seq in 293 T-REx cells. RT-qPCR using the primers indicated was performed from vector control (Mock) or NFH-AUTS2 stable cell lines induced by doxycycline (+NFH-AUTS2). All values are the mean of three technical replicates and error bars represent standard deviation.
Extended Data Figure 9
Generation of mice with Auts2 conditional knockout in the nervous system and additional developmental phenotypes. a ES cells carrying an engineered allele of Auts2 were generated through homologous recombination. Specifically, two LoxP sites were placed flanking exon 7 of Auts2. A cassette containing SA-IRES-tdTomato and an inverted PGK-Neo (neomycin phosphotransferase gene) were flanked by two FRT (FLP recombinase target) sites and inserted between the first LoxP site and exon 7. A WPRE (woodchuck hepatitis post-transcriptional regulatory element) sequence was placed immediately downstream of tdTomato to enhance its expression. Homologous mice carrying this engineered sequence are expected to give rise to a transcript containing only the first six exons of Auts2 followed by IRES-driven tdTomato. Red fluorescence serves as a marker for successful gene targeting. To obtain the conditional deletion of Auts2, these mice were crossed with FLIP mice to excise the FRT flanking sequence, resulting in floxed mice, which were then crossed with Nestin-Cre deleter mice to generate Auts2 deletion in the nervous system. b Genotyping of the Auts2 flox mice by PCR. The fast migrating species of 225 bp represents the PCR product of WT, and the species of 317 bp corresponds to the KO. c KO mice are significantly shorter than both HET and WT mice across development. d No significant difference in body weight was detected at P1, however, a significantly reduced milkb and was observed in Auts2 KO. e The KO mice took significantly longer to orient their nose to an upward position. # Post-hoc difference (p < 0.05) between WT and KO.
Extended Data Figure 10
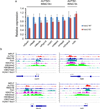
Altered expression of genes targeted by PRC1-AUTS2 in brains of Auts2 KO mice. a Expression profiles of select genes simultaneously targeted by AUTS2 and RING1B (labeled as AUTS2+ RING1B+). As negative control, two non-target genes were used (labeled as AUTS2- RING1B-). Total RNAs were extracted from whole brains of either WT or KO mice, followed by reverse transcription to generate cDNAs for RT-qPCR. Expression levels are normalized over those in WT. All mean values of expression levels and standard errors were calculated from duplicated measurements of three biological replicates. b IGV views of four representative loci for genes examined as in a, showing the enrichment of AUTS2, RING1B, PolII, and active histone marks.
Figure 1
Figure 1. Characterization of the PRC1.5-AUTS2 complex
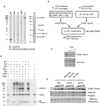
a Heat map of PCGF5- and AUTS2-associated polypeptides. Sequential FLAG and HA affinity purification (TAP) followed by liquid chromatography-mass spectrometry (LC-MS) (Methods) was performed in inducible 293T-REx cells expressing FLAG-HA-tagged bait proteins (PCGF5 TAP from an earlier report) indicated at the top. The spectrum count of each protein is color-coded and displayed as a heat map. b Immunoprecipitation (IP) from nuclear extract (NE) of NFH-AUTS2 cells in the absence or presence of doxycycline at 100 µg/ml, using HA beads. Bound proteins were resolved on SDS-PAGE and detected by Western blotting for the antigens indicated. 5% of input was loaded in all cases, unless indicated otherwise. c IP from NE of mouse brain using AUTS2 antibody, followed by Western blotting for the antigens indicated. d Glycerol gradient (15–35%) analysis of FLAG-purified NFH-AUTS2 complexes. Every other fraction was resolved on SDS-PAGE followed by immunoblotting for the antigens indicated. e – g IP with lysates from Sf9 cells expressing the proteins indicated, using HA (e) or FLAG beads (f and g), followed by Western blotting using FLAG or HA antibodies. h Schematic organization of PRC1.5-AUTS2. See text for details.
Figure 2
Figure 2. Impact of AUTS2 on chromatin architecture and transcription
a Schematic of the luciferase reporter system. b Fold change in luciferase activity in cells expressing GAl4, GAl4-RING1B, GAl4-PCGF4, GAl4-PCGF5, GAl4-AUTS2, and FLAG-HA-AUTS2, after 24 hr doxycycline (100 µg/ml) induction. In this and subsequent luciferase reporter assays, each value is the mean of three independent measurements with error bars representing standard error. * indicates p<0.05 by two-sided t-test, compared with GAL4 control. c – d ChIP using the antibodies indicated and GAl4-AUTS2 and GAl4-PCGF5 cells, respectively, before and after doxycycline induction. ChIP enrichment is expressed as percentage of input. All center values represent the average of three technical replicates with error bars indicating standard deviation in this and all other ChIP experiments ELSEWHERE IN THE ARTICLE.
Figure 3
Figure 3. CK2 inhibits H2A monoubiquitination activity of PRC1.5-AUTS2
a In vitro nucleosomal H2A monoubquitination assay using RING1B-PCGF5-AUTS2 expressed in and purified from Sf9 cells (Methods), as a function of the presence of recombinant CK2. Reaction products were resolved on SDS-PAGE, followed by immunoblotting for H2AK119ub1. Ponceau staining of histones is shown (bottom). b Effect of heat-treatment of CK2 at 95°C for 15 min prior to addition to the H2A monoubquitination assay performed as in a. c H2A monoubquitination assay (Methods) using increasing amounts of RING1B-PCGF5-AUTS2 containing either RING1B-S168A (S168 to alanine), or RING1B-S168E (S168 to glutamic acid), purified from sf9 cells. d Densitometry of H2A monoubquitination based on three independent experiments as in c. Quantification was done by using Image J. Error bars represent standard deviation.
Figure 4
Figure 4. AUTS2 recruits P300 for gene activation
a ChIP analysis of P300 in GAl4-AUTS2 cells, before and after doxycycline induction, as indicated. b Fold change in luciferase activity in GAl4-AUTS2 cells with control (si-contr) or P300 siRNA (si-P300) treatment for 48 hr prior to 24 hr doxycycline induction. Insert shows immunoblotting of samples used for luciferase reporter assays using the antibodies indicated. The p value derived from two-sided t-test is indicated here and in c. c Fold change in luciferase activity in GAl4-AUTS2 cells with or without C646 (Sigma) for 16 hr prior to 24 hr doxycycline induction. d Mapping of AUTS2 domains required for transcriptional activation. Shown are schematic representations of stably expressed, truncated versions of AUTS2 fused to GAL4 (left) and their ability to stimulate luciferase activity (right). e ChIP in stable cell lines expressing the candidates shown in d and performed with antibodies against GAL4 and P300.
Figure 5
Figure 5. Regulation of neuronal gene expression by AUTS2
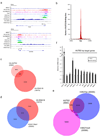
a IGV browser views for input, AUTS2, RING1B, Pol II, H3K27ac, H3K4me3, H3K36me3, H3K27me3, and H2AK119ub1. ChIP-seq performed in P1 mouse brain at two representative loci indicated. The y axis corresponds to ChIP-seq signal intensity. b Venn diagram showing the overlap among target regions of AUTS2, H3K27ac, and H2AK119ub1. c Expression analysis of genes targeted by AUTS2/RING1B, AUTS2 alone, BMI1/RING1B, and BMI1 alone. RPKM (reads per kilobase of exon per million reads mapped) values are obtained from our RNA-seq data in mouse whole brain. d ChIP reads density plots for levels of indicated histone marks and PolII at loci co-targeted by AUTS2/RING1B and BMI1/RING1B. A ±2 kb window relative to the center of peaks is shown. e GO analysis of targeted genomic regions identified by AUTS2 ChIP-seq, using GREAT. The x axis (in logarithmic scale) corresponds to the binomial raw p values.
Figure 6
Figure 6. Effect of Auts2 KO on phenotypes associated with neurodevelopmental disorders
a Comparison of the body size of WT, HET, and KO littermates. Insert shows immunoblotting of respective whole brain extracts. b Both KO and HET mice weigh less than WT littermates across P3-P9. Data reported in all behavioral figure are mean and error bars are standard error of the mean. Post-hoc difference (p< 0.05) is indicated by * (between all three genotypes), # (between WT and KO), and $ (between HET and KO). Total numbers of mice used in the behavioral analyses are as following (the range reflects different numbers used for each behavioral test): at P3, WT 11–17, HET 3–10, KO 6–11; at P5, WT 23–27, HET 8–13, KO 18–19; at P7, WT 7–11, HET 3, KO 8; at P9, WT 4–8, HET 2–7, KO 3. c KO mice show impairment in righting reflex relative to WT from P3-P9, while HET are not impaired. d Both HET and KO mice show significantly less ultrasonic vocalizations (USVs) than WT following maternal separation across the majority of developmental time points measured. e A model for PRC1.5-AUTS2-mediated transcriptional activation. See text for details.

References

    1. Simon JA, Kingston RE. Occupying chromatin: Polycomb mechanisms for getting to genomic targets, stopping transcriptional traffic, and staying put. Molecular cell. 2013;49:808–824. - PMC - PubMed
    1. Muller J, Verrijzer P. Biochemical mechanisms of gene regulation by polycomb group protein complexes. Current opinion in genetics & development. 2009;19:150–158. - PubMed
    1. Morey L, Helin K. Polycomb group protein-mediated repression of transcription. Trends Biochem Sci. 2010;35:323–332. - PubMed
    1. Schuettengruber B, Cavalli G. Recruitment of polycomb group complexes and their role in the dynamic regulation of cell fate choice. Development. 2009;136:3531–3542. - PubMed
    1. Jaenisch R, Young R. Stem cells, the molecular circuitry of pluripotency and nuclear reprogramming. Cell. 2008;132:567–582. - PMC - PubMed

References (For Methods)

    1. Vaquero A, et al. Human SirT1 interacts with histone H1 and promotes formation of facultative heterochromatin. Mol Cell. 2004;16:93–105. - PubMed
    1. Kriaucionis S, Heintz N. The nuclear DNA base 5-hydroxymethylcytosine is present in Purkinje neurons and the brain. Science. 2009;324:929–930. - PMC - PubMed
    1. Langmead B, Trapnell C, Pop M, Salzberg SL. Ultrafast and memory-efficient alignment of short DNA sequences to the human genome. Genome Biol. 2009;10 - PMC - PubMed
    1. Li H, et al. The Sequence Alignment/Map format and SAMtools. Bioinformatics. 2009;25:2078–2079. - PMC - PubMed
    1. Robinson JT, et al. Integrative genomics viewer. Nat Biotechnol. 2011;29:24–26. - PMC - PubMed

Publication types

MeSH terms

Associated data