. 2015 Feb;92(2):37.
doi: 10.1095/biolreprod.114.126326. Epub 2014 Dec 17.

Processive pulses of retinoic acid propel asynchronous and continuous murine sperm production

Affiliations

Processive pulses of retinoic acid propel asynchronous and continuous murine sperm production

Cathryn A Hogarth et al. Biol Reprod. 2015 Feb.

Abstract

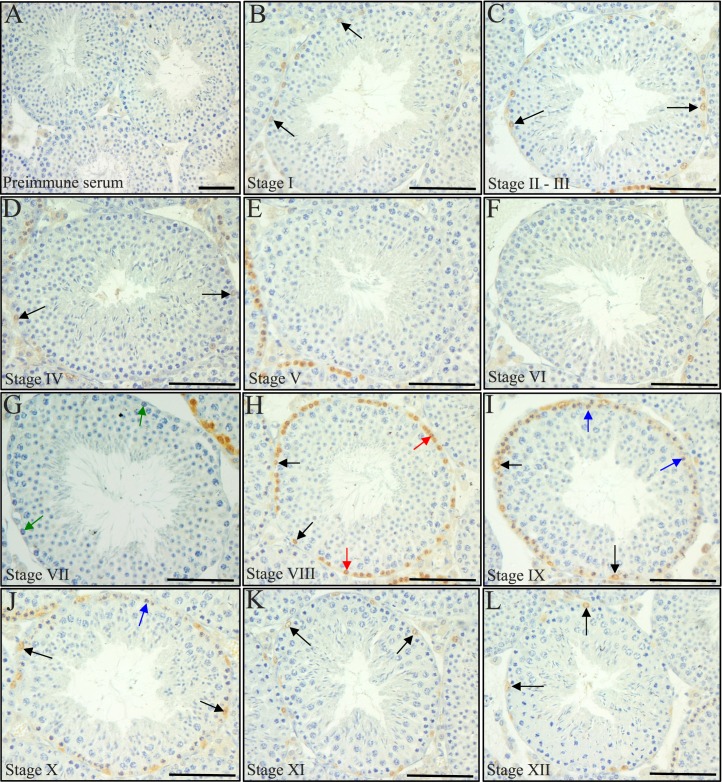
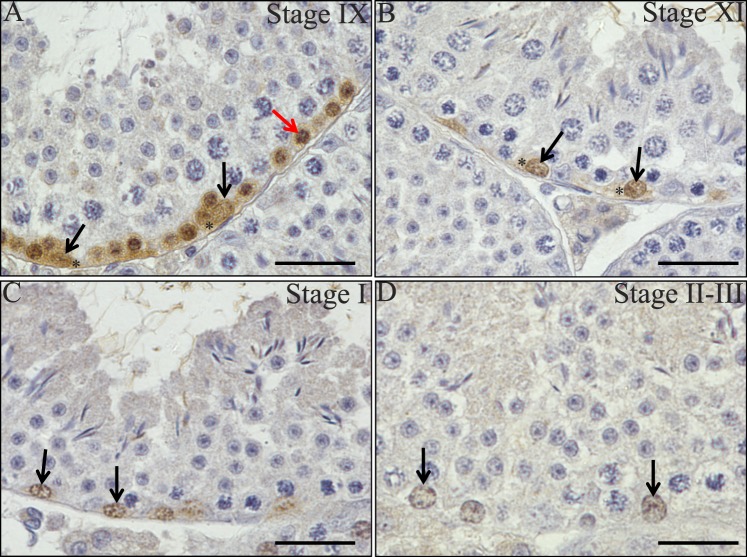
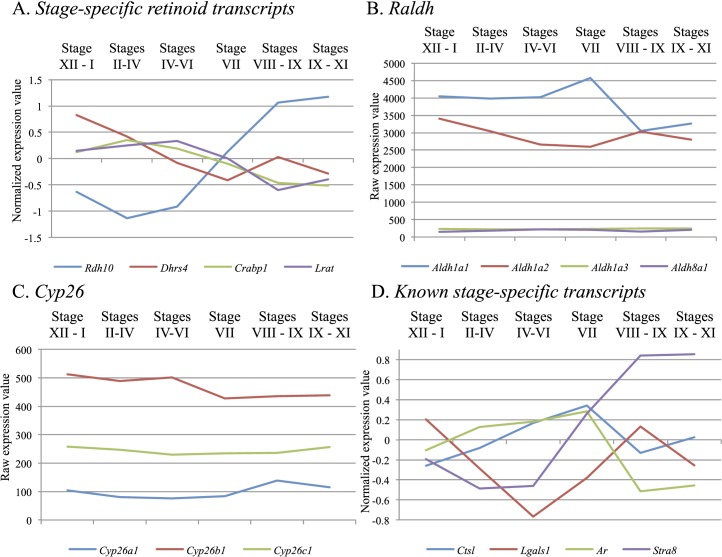
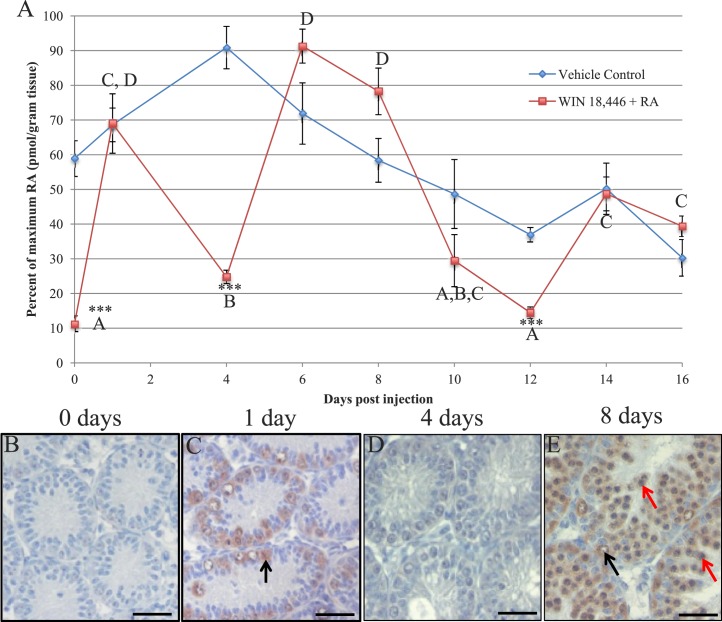
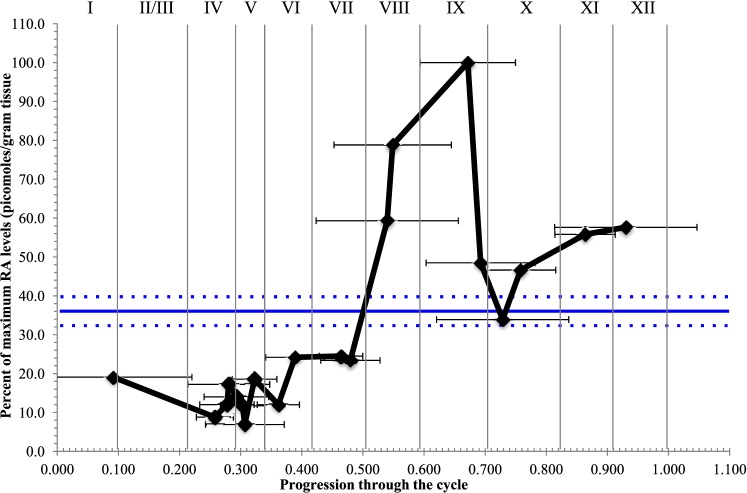
The asynchronous cyclic nature of spermatogenesis is essential for continual sperm production and is one of the hallmarks of mammalian male fertility. While various mRNA and protein localization studies have indirectly implicated changing retinoid levels along testis tubules, no quantitative evidence for these changes across the cycle of the seminiferous epithelium currently exists. This study utilized a unique mouse model of induced synchronous spermatogenesis, localization of the retinoid-signaling marker STRA8, and sensitive quantification of retinoic acid concentrations to determine whether there are fluctuations in retinoid levels at each of the individual stages of germ cell differentiation and maturation to sperm. These data show that processive pulses of retinoic acid are generated during spermatogonial differentiation and are the likely trigger for cyclic spermatogenesis and allow us, for the first time, to understand how the cycle of the seminiferous epithelium is generated and maintained. In addition, this study represents the first direct quantification of a retinoid gradient controlling cellular differentiation in a postnatal tissue.

Keywords: retinoic acid; spermatogenesis; spermatogonia; testis.


Figures

FIG. 1
FIG. 1
The RA pulse hypothesis. Various in situ hybridization and immunohistochemistry experiments have led us and others to propose a model whereby retinoid storage, synthesis, and/or degradation is regulated such that RA levels are lowest during Stages II–VI and peak at Stage VIII of the cycle of the seminiferous epithelium during testis development. Processes known to be regulated by RA, including spermatogonial differentiation, spermiation, and blood-testis barrier reorganization, all take place during Stage VIII, and there is currently no known role for RA during Stages II–VI.
FIG. 2
FIG. 2
STRA8 displays a stage-specific localization pattern. AL) Pictures depict STRA8 localization in every stage of the cycle of the seminiferous epithelium in a wild-type adult mouse testis. Black arrows denote STRA8-positive spermatogonia, red arrows denote STRA8-positive preleptotene spermatocytes, green arrows denote STRA8-negative preleptotene spermatocytes in Stage VII, and blue arrows denote STRA8-positive leptotene spermatocytes. Control sections were incubated with preimmune serum (A). Bars = 50 μm.
FIG. 3
FIG. 3
STRA8 displays cell type-specific intracellular localization patterns in the testis. AD) Pictures depict STRA8 localization in Stages IX (A), XI (B), I (C), and II–III (D) of the cycle of the seminiferous epithelium in a wild-type adult mouse testis. Black arrows denote STRA8-positive nuclei, and asterisks denote STRA8-positive cytoplasm within spermatogonia. The red arrow highlights a STRA8-positive nucleus within a preleptotene spermatocyte. Bars = 20 μm.
FIG. 4
FIG. 4
Stages II–VI are the most susceptible to exogenous RA treatment. AC) Pictures depicting STRA8 localization in Stages II–VI in vehicle control (A) and RA-treated (B, C) vitamin A-sufficient adult male mice. Black arrows denote STRA8-positive spermatogonia, red arrows denote STRA8-negative spermatogonia, and stages are indicated by roman numerals in the center of the tubules. Bars = 50 μm. D) Graphs depicts quantification of the numbers of STRA8-positive spermatogonia per tubule in four different groups of stages (XII–I, II–VI, VII–VIII, IX–XI) from vehicle control (black bars) and RA-treated (white bars) vitamin A-sufficient adult male mice. The average number (n = 3) of STRA8-positive spermatogonia per tubule is given on the Y axis with the stages listed on the X axis. The error bars represent SEM (***P < 0.0005, **P < 0.01).
FIG. 5
FIG. 5
Cyclic changes in retinoid metabolizing enzymes can be detected in the synchronized testis. Graphs depicting either normalized (A and D) or raw (B and C) microarray expression data for various retinoid storage, binding, and metabolism genes and transcripts known to exhibit stage-specificity in adult mouse testes displaying synchronized spermatogenesis. Retinoid-related transcripts demonstrating statistically significant stage-specificity are shown in A, the absence of stage-specificity for the RALDH and CYP26 enzymes can be seen in B and C, respectively, and the validity of the microarray is shown in D, which depicts expression of known stage-specific transcripts consistent with previous publications [17, 20, 28, 29]. For each graph, the Y axis displays the microarray expression value with the stage(s) of the seminiferous epithelium given on the X axis. The normalized expression value was plotted for two of these graphs (A and D) to aid in visualizing transcripts that have very different raw expression values but display interesting trends in expression across the cycle.
FIG. 6
FIG. 6
Pulses of RA can be detected in the synchronized neonatal testis. A) Graph depicts RA levels in vehicle control (blue line) and WIN 18,446/RA-treated testes (red line) over the course of the first two waves of synchronized spermatogenesis. The treated animals received either an injection of vehicle control (control samples) or RA (WIN 18,446/RA-treated samples) at time zero. Percent of maximum RA level is given on the Y axis and has been plotted against days postinjection on the X axis. Student t-tests were performed to compare treated to vehicle control samples at each time point (asterisks) and to compare only the treated samples between time points (letters). Asterisks (***) denote a significant difference (P < 0.001) between treated and vehicle control samples. Time points marked with different letters indicated statistically different (P < 0.05) RA levels between samples from the WIN 18,446/RA-treated animals. BE). Pictures depicting STRA8 localization in cross-sections of testes collected from WIN 18,446 only-treated animals (B) and from animals allowed either 1 day (C), 4 days (D), or 8 days (E) of recovery following WIN 18,446/RA treatment. Black arrows denote STRA8-positive spermatogonia, and red arrows denote STRA8-positive preleptotene spermatocytes. Bars = 20 μm.
FIG. 7
FIG. 7
RA concentration peaks at Stage IX of the cycle of the seminiferous epithelium. Graph depicts RA levels in adult mouse testes treated with either vehicle control (blue line) or WIN 18,446 and RA (black line) to synchronize spermatogenesis. Samples (n = 20) from the WIN 18,446/RA-treated animals were collected at 12 h intervals between 42 and 50 days postinjection and plotted according to their midpoint of synchrony, which is representative of progression through the spermatogenic cycle (X axis). RA concentration is given as a percentage of the maximum level detected (pmol/g tissue weight) and is given on the Y axis. Student t-tests were performed and demonstrated that there is significantly higher RA levels in Stages VII–IX (P < 0.05) and that there is significantly lower RA levels in Stages II–VI (P < 0.001) when compared to all the other stages. Samples (n = 5) from the vehicle control-treated animals were collected at 2 day intervals between 42 and 50 days postinjection. The average RA concentration (given as percentage of the maximum level detected) measured in the vehicle control samples is represented by the solid blue line, with the dotted line above and below representing the SEM, because progression through the cycle cannot be calculated for nonsynchronized samples. The black horizontal error bars represent the window width analysis for the WIN 18,446/RA samples.

References

    1. Begemann G, Meyer A. Hindbrain patterning revisited: timing and effects of retinoic acid signalling. Bioessays. 2001;23:981–986. - PubMed
    1. Briggs LJ, Stein D, Goltz J, Corrigan VC, Efthymiadis A, Hubner S, Jans DA. The cAMP-dependent protein kinase site (Ser312) enhances dorsal nuclear import through facilitating nuclear localization sequence/importin interaction. J Biol Chem. 1998;273:22745–22752. - PubMed
    1. Diez del Corral R, Olivera-Martinez I, Goriely A, Gale E, Maden M, Storey K. Opposing FGF and retinoid pathways control ventral neural pattern, neuronal differentiation, and segmentation during body axis extension. Neuron. 2003;40:65–79. - PubMed
    1. Towers M, Wolpert L, Tickle C. Gradients of signalling in the developing limb. Curr Opin Cell Biol. 2012;24:181–187. - PubMed
    1. Bowles J, Knight D, Smith C, Wilhelm D, Richman J, Mamiya S, Yashiro K, Chawengsaksophak K, Wilson MJ, Rossant J, Hamada H, Koopman P. Retinoid signaling determines germ cell fate in mice. Science. 2006;312:596–600. - PubMed

Publication types