. 2014 Dec 18:5:5863.
doi: 10.1038/ncomms6863.

Telomerase expression confers cardioprotection in the adult mouse heart after acute myocardial infarction

Affiliations

Telomerase expression confers cardioprotection in the adult mouse heart after acute myocardial infarction

Christian Bär et al. Nat Commun. .

Abstract

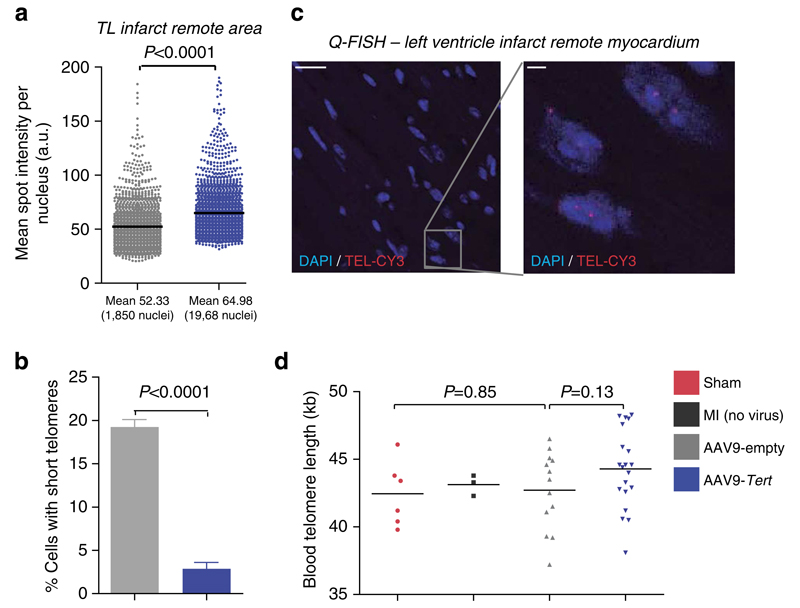
Coronary heart disease is one of the main causes of death in the developed world, and treatment success remains modest, with high mortality rates within 1 year after myocardial infarction (MI). Thus, new therapeutic targets and effective treatments are necessary. Short telomeres are risk factors for age-associated diseases, including heart disease. Here we address the potential of telomerase (Tert) activation in prevention of heart failure after MI in adult mice. We use adeno-associated viruses for cardiac-specific Tert expression. We find that upon MI, hearts expressing Tert show attenuated cardiac dilation, improved ventricular function and smaller infarct scars concomitant with increased mouse survival by 17% compared with controls. Furthermore, Tert treatment results in elongated telomeres, increased numbers of Ki67 and pH3-positive cardiomyocytes and a gene expression switch towards a regeneration signature of neonatal mice. Our work suggests telomerase activation could be a therapeutic strategy to prevent heart failure after MI.


Conflict of interest statement

Competing financial interests The authors declare no competing financial interests.

Figures

Figure 1
Figure 1. Specific targeting of Tert to the heart.
(a) Anti-eGFP immunohistochemistry to assess tropism of AAV9-eGFP viruses to the myocardium. Different concentrations of viruses are indicated. Scale bars, 1,000 μm (top row); (200 μm) in higher magnification images. (b) Tropism at the indicated AAV9-eGFP viral concentration to the liver and brain. Scale bars, 1,000 μm (top row); 200 μm (bottom row). Black arrows indicate eGFP-positive cells. (c) Percentage of viral transduction in the indicated tissues. (d) AAV9 specifically transduces cardiomyocytes. Co-immunostaining of LV tissue section was done with anti-myosin heavy chain (MHC) to stain cardiomyocytes (red) and with anti-eGFP (green) antibodies to identify infected cardiomyocytes. Cell nuclei were stained with DAPI (blue). Scale bar, 50 μm. (e) Percentage of eGFP-positive (AAV9 infected) cardiomyocytes or cardiac fibroblasts. (f) Fold changes in mRNA levels of Tert after injection of different AAV9-Tert doses in the heart and liver relative to non-injected animals (no virus). (g) Telomerase activity in extracts of sham and MI hearts infected with AAV9-empty or AAV9-Tert was determined following the telomeric repeat amplification protocol (TRAP). All graphs show mean values, error bars indicate s.e.m, n = number of mice. Two-sided Student’s t-test was used for statistical analysis and P-values are shown.
Figure 2
Figure 2. Tert reduces mortality and rescues cardiac function after MI.
(a) Kaplan–Meier survival curves after MI, indicating 17% improved survival after Tert treatment and MI. Statistical analysis was calculated χ2-test. n, number of mice. (b–d) Echocardiography at 1 and 3 weeks in mice injected with AAV9-Tert (blue bars), AAV9-empty (light grey bars) or no virus (dark grey bars) (all three groups suffered MI); or sham-operated mice (red bars) (no virus, no MI) reveals functional improvement in the Tert-treated group. Note, same colours are used throughout the paper. (b) LV end-systolic area, (c) LV end-diastolic area, (d) ejection fraction. n, number of mice; bars show mean values with s.e.m. (error bars). Two-sided Student’s t-test was used for statistical analysis and P-values are shown.
Figure 3
Figure 3. Reduced infarct severity coincides with less fibrosis.
(a) Percentage of AAV9-empty or AAV9-Tert mice that died during or shortly after PET scan. n, number of mice. Statistical analysis: χ2-test, P-value is depicted. (b) Infarct severity in AAV9-Tert and AAV9-empty cohorts was assessed in in vivo FDG-PET scans 4 weeks after LAD ligation. A higher number of hearts with signal loss was found in the AAV9-empty group. (c) Representative PET scan images of a fully functional heart (left) and failing hearts after MI (right). (d) Representative Masson’s trichrome stainings of transverse heart sections of a healthy heart (left) and LAD ligated hearts with infarct scar (right). Fibrotic infarct areas stain in blue and infarct remote in red as indicated. Scale bar, 1 mm. (e) Average scar length relative to the LV endocardial circumference of indicated groups shown as mean with s.e.m. (f) Interstitial fibrotic area relative to total area measured in the infarct remote myocardium shown as mean with s.e.m. n, number of mice. Statistical analysis: two-sided Student’s t-test, P-values are shown.
Figure 4
Figure 4. Telomerase expression results in longer telomeres in cardiac cells.
(a) TL was determined by Q-FISH analysis on heart tissue sections after MI in the left ventricular infarct remote area in mice transduced with AAV9-Tert and AAV9-empty. Four animals (hearts) per group were analysed (n = 4). TL is represented as mean telomere fluorescence per nucleus in arbitrary units of fluorescence (a.u.). The black line indicates mean TL. Statistical analysis: two-sided Student’s t-test, P-values are depicted. Scale bar, 25 μm. (b) Fractions of nuclei per mouse (from A), which fall below the 20th percentile of the control (AAV9-empty) TL are represented as the percentage of cells with short telomeres. Statistical analysis: two-sided Student’s t-test, P-values are shown. (c) Representative images of heart sections subjected to telomere Q-FISH analysis. Nuclei are stained with DAPI and telomeres with a specific CY3-labelled probe. Nuclei stained with DAPI (blue) and telomeres with CY3-labelled probe (red). Scale bars, 20 μm (left image); 2 μm (zoom in). (d) TL (in kb) measured in peripheral blood leukocytes by using HT-Q-FISH technology. Each spot represents the mean TL of one individual mouse (from left to right n = 6, 3, 13, 20). Mean TL among all mice per group is indicated by the black horizontal lines. Statistical analysis: two-sided Student’s t-test, P-values are shown.
Figure 5
Figure 5. Tert leads to an increase in Ki67- and pH3-positive cardiomyocytes.
(a) Representative confocal immunofluorescence images demonstrating co-localization of Ki67 (green) and the cardiomyocyte marker Troponin T (red) in the infarct vicinity. Nuclei stained in blue with DAPI. (IZ, infarct zone; SI, subinfarct zone; CM, cardiomyocyte; nCM, non-cardiomyocyte). Scale bar, 50 μm. (b) Quantification of Ki67-positive cardiomyocytes in the infarct adjacent area given as percentage of total cells. Four to eight fields of three mice each per group were counted (n = 3). (c) Representative confocal immunofluorescence images demonstrating colocalization of pH3 (green) and the cardiomyocyte marker Troponin T (red) in the infarct vicinity (CM, cardiomyocyte; nCM, non-cardiomyocyte). DAPI-stained nuclei in blue. Scale bar, 25 μm. (d) Quantification of pH3-positive cardiomyocytes in the infarct adjacent area given as percentage of total cells. Thirty fields per heart and six mice of each group were counted (n = 6). Bar graphs show mean values with s.e.m. Statistical analysis: two-sided Student’s t-test, P-values are shown.
Figure 6
Figure 6. Tert rescues serum parameters associated with heart failure.
(a) Serum urea concentration as a measure of renal and heart functionality was determined in the indicated groups. n, number of mice. Statistical analysis: two-sided Student’s t-test, P-values are shown. (b) Individual heatmaps (from blue—lowest, to red—highest value) of serum concentration of the indicated biomarkers comparing three conditions: MI + AAV9-empty (n = 8), MI + AAV9-Tert (n = 8), sham (no virus) (n = 4). n, number of mice. The indicated numbers within squares represent true values in pg μl−1 serum. (c) A selection of serum biomarkers with implications in heart biology that show significant changes between MI and sham animals as determined in multi-analyte profiling represented as box and whiskers plot. Statistical analysis: Mann-Whitney U-test, P-values are shown. (d) Relative mRNA expression level (qRT–PCR) of ANP in non-infarcted mice (>2years). Mean values with s.e.m are represented. n, number of mice. Statistical analysis: two-sided Student’s t-test, P-values are shown.
Figure 7
Figure 7. Gene expression changes induced by Tert expression in the heart.
(a) Summary table indicating that various gene sets are differentially regulated in the comparisons MI versus sham and Tert (MI) versus empty (MI). The corresponding affected biological pathways are indicated. (b) GSEA plots for the indicated pathways in heart tissue. Microarray genes were ranked based on the two-tailed t-statistic tests obtained from the AAV9-Tert versus AAV9-empty by pair-wise comparisons. The red to blue horizontal bar represents the ranked list. Those genes showing higher expression levels for each cohort are located at the edges of the bar (I = infarct + AAV9-empty; IT infarct + AAV9-Tert). The genes located at the central area of the bar show small differences in gene expression fold changes between both groups. A heatmap of indicated core-enriched genes is displayed on the right of each enrichment plot. (c) Relative mRNA expression level (qRT-PCR) of Fgfr3, Bmpr1b, Irf7 and Itgb6 in AAV9-empty versus AAV9-Tert confirm candidate genes found among the most differentially expressed genes in GSEA represented as fold change relative to AAV9-empty group. n, number of mice. Mean values with s.e.m are represented. Statistical analysis: two-sided Student’s t-test, P-values are shown. (d) GSEA analysis reveals a regenerative signature in Tert-treated mice. The represented gene sets were generated using the expression profiles in neonatal mice (day1 = D1) described by Haubner et al. Selections for up- and downregulated genes were based on FDR values <0.01 in their comparison of gene expression profiles between D1 and D10. For GSEA Kolmogorov–Smirnoff testing was used for statistical analysis. The FDR is calculated by Benjamini and Hochberg FDR correction.

References

    1. Mudd JO, Kass DA. Tackling heart failure in the twenty-first century. Nature. 2008;451:919–928. - PubMed
    1. Liew CC, Dzau VJ. Molecular genetics and genomics of heart failure. Nat Rev Genet. 2004;5:811–825. - PubMed
    1. Cohn JN, Ferrari R, Sharpe N. Cardiac remodeling--concepts and clinical implications: a consensus paper from an international forum on cardiac remodeling. Behalf of an International Forum on Cardiac Remodeling. J Am Coll Cardiol. 2000;35:569–582. - PubMed
    1. Dominguez LJ, et al. Ageing, lifestyle modifications, and cardiovascular disease in developing countries. J Nutr Health Aging. 2006;10:143–149. - PubMed
    1. Bergmann O et al. Evidence for cardiomyocyte renewal in humans. Science. 2009;324:98–102. - PMC - PubMed

Publication types

MeSH terms

Associated data