. 2014 Dec 18:5:5768.
doi: 10.1038/ncomms6768.

Competition between items in working memory leads to forgetting

Affiliations

Competition between items in working memory leads to forgetting

Jarrod A Lewis-Peacock et al. Nat Commun. .

Abstract

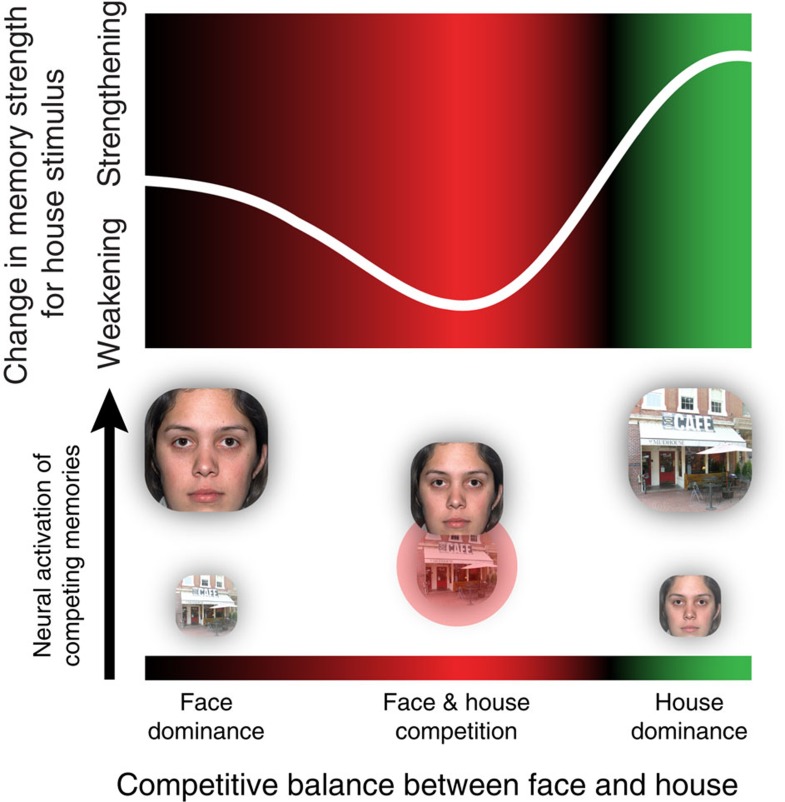
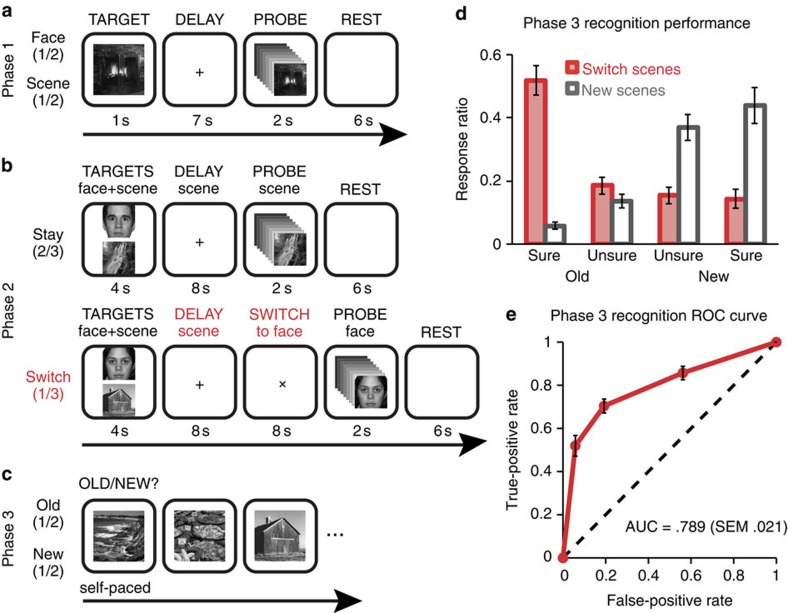
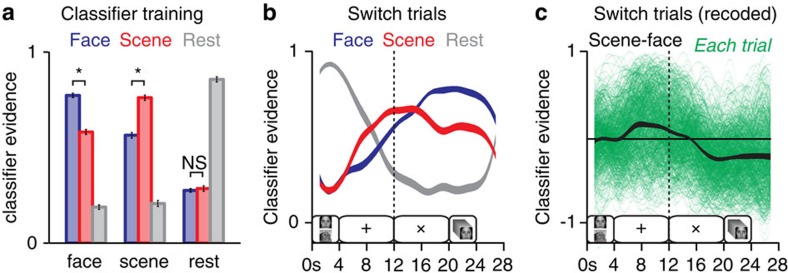
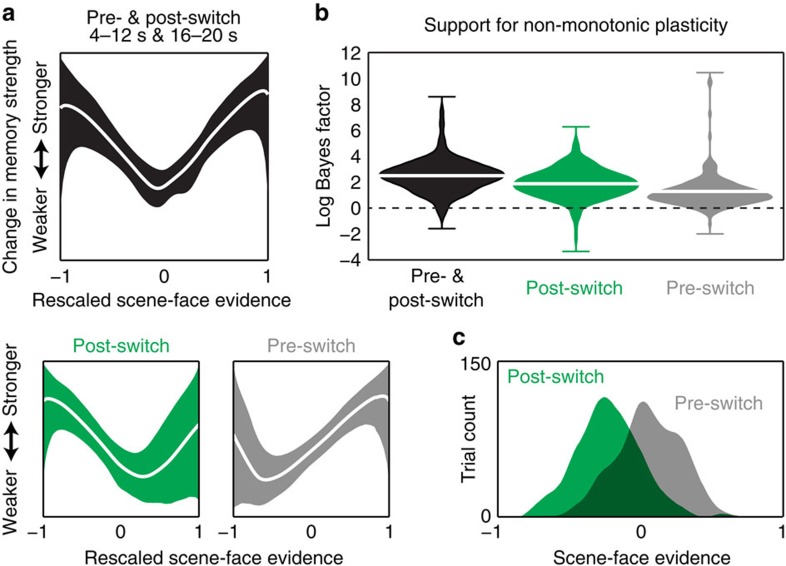
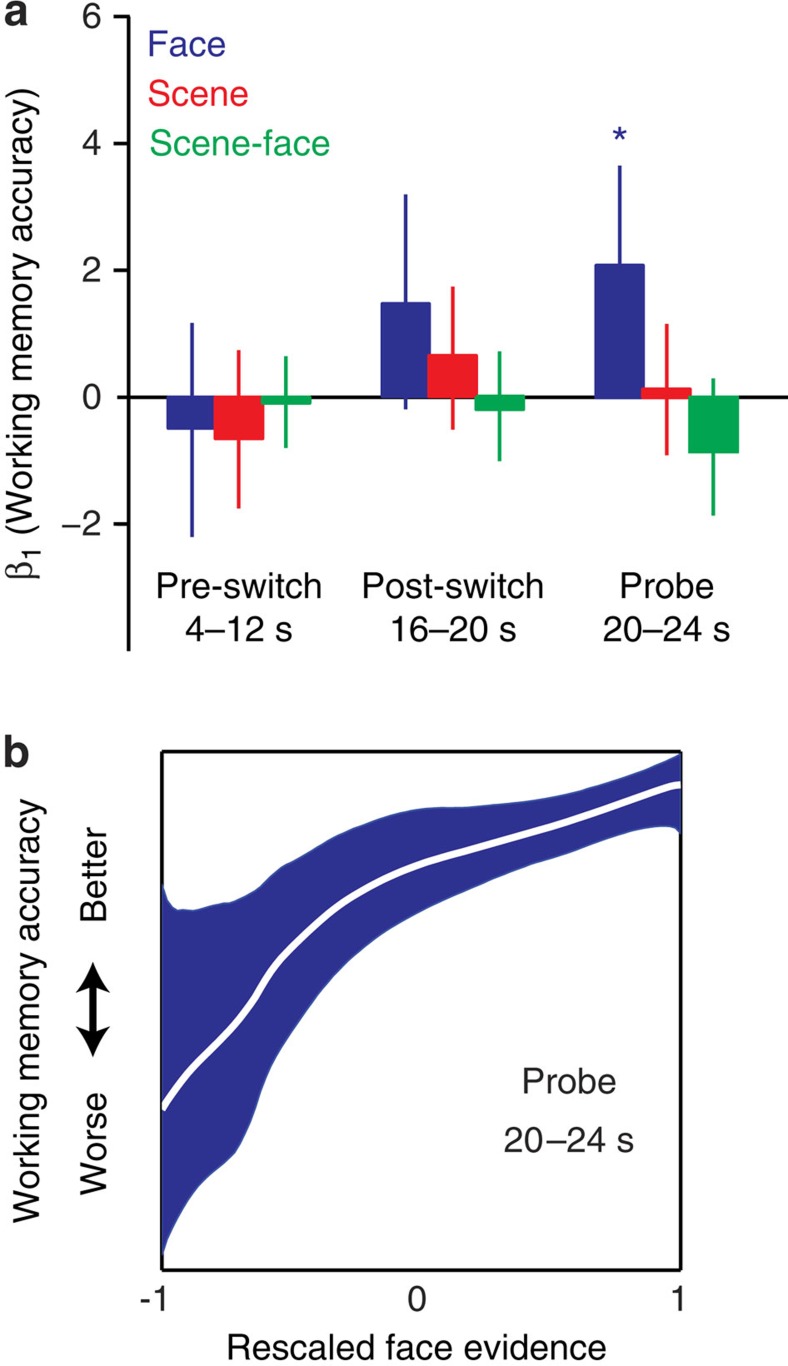
Switching attention from one thought to the next propels our mental lives forward. However, it is unclear how this thought-juggling affects our ability to remember these thoughts. Here we show that competition between the neural representations of pictures in working memory can impair subsequent recognition of those pictures. We use pattern classifiers to decode functional magnetic resonance imaging (fMRI) data from a retro-cueing task where participants juggle two pictures in working memory. Trial-by-trial fluctuations in neural dynamics are predictive of performance on a surprise recognition memory test: trials that elicit similar levels of classifier evidence for both pictures (indicating close competition) are associated with worse memory performance than trials where participants switch decisively from thinking about one picture to the other. This result is consistent with the non-monotonic plasticity hypothesis, which predicts that close competition can trigger weakening of memories that lose the competition, leading to subsequent forgetting.


Figures

Figure 1
Figure 1. Hypothesized ‘plasticity curve’ describing how competition between memories drives learning.
If a memory competes and clearly wins, it ends up being highly active and is strengthened; if the memory competes but does not win, it ends up being moderately active and is weakened; if the memory does not compete strongly, nothing happens. The background colour redundantly codes whether different levels of memory activation are linked to weakening (red) or strengthening (green). The diagram below the curve depicts different states of face/house competition that could occur during the rendezvous example in the text. When switching from the ‘house dominance’ state on the right to the ‘face dominance’ state on the left (or vice versa), the face and house pass through the ‘weakening zone’ of the plasticity curve where they are thrust into close competition with each other, resulting in moderate levels of house activity and (through this) weakening of the house memory. The greater the amount of time that the house spends in this ‘weakening zone’, the worse subsequent memory for the house will be.
Figure 2
Figure 2. Task procedures and subsequent memory performance.
(a) Participants performed delayed-recognition of a face or a scene picture during Phase 1. (b) Participants then performed retro-cued delayed recognition of one stimulus from a pair of target pictures (one face, one scene) during Phase 2. On 2/3 of the these trials, participants were tested on the scene (Stay trials); on 1/3 of the these trials, participants were given a switch cue at the end of the initial delay period, informing them that they would be tested on the face, not the scene (Switch trials). (c) In Phase 3 at the end of the experiment, participants were given a surprise memory test for scenes that were previously studied on Switch trials in Phase 2, and for new scenes. (d) Recognition confidence judgments for old and new scenes in Phase 3. (e) Recognition memory sensitivity as assessed by receiver operating characteristic (ROC) analysis for old scenes in Phase 3. AUC, area under the ROC curve. Error bars indicate the s.e.m., n=21.
Figure 3
Figure 3. Pattern classification of fMRI data.
(a) Classifier evidence scores for Phase 1 data, obtained by training the classifier on all but one Phase 1 block and testing on the remaining block. Face evidence is blue, scene evidence is red and resting-state evidence is grey (*P<0.001, face versus scene, paired t-test). (b) Trial-averaged decoding of switch trials from Phase 2, with evidence values interpolated between discrete data points every 2 s. Trial events are diagrammed along the horizontal axis. (c) Recoded classifier evidence scores (‘scene–face’) for switch trials overlaid on a distribution of single-trial traces from every participant. (Error bars and ribbon thickness indicate the s.e.m. across participants, n=21; see Supplementary Figs 2 and 3 for individual-subject versions of these plots). Note that in these plots classifier evidence scores were not shifted to account for haemodynamic lag.
Figure 4
Figure 4. Relating classifier evidence on switch trials to subsequent recognition memory.
(a) Empirically derived estimates (generated using the Bayesian P-CIT algorithm7) of the ‘plasticity curve’ relating scene–face evidence on switch trials to Phase 3 subsequent memory strength (operationalized as recognition confidence). Within each box, the line shows the mean of the posterior distribution over curves and the ribbon shows the 90% credible interval (such that 90% of the curve probability mass lies within the ribbon). The horizontal axis shows scene–face classifier evidence scores rescaled so that the minimum classifier evidence value=−1 and the maximum classifier evidence value=1; the vertical axis represents the change in subsequent memory strength. The box on the top shows the estimated curve when behavioural outcomes are modelled as depending on the summed effects of pre-switch (4–12 s) and post-switch (16–20 s) classifier evidence. The two boxes on the bottom show the estimated plasticity curve when behavioural outcomes are modelled as depending only on post-switch or pre-switch classifier evidence, respectively (n=21). (b) Violin plots describing the balance of evidence (operationalized in terms of log Bayes factor) in favour of the non-monotonic plasticity hypothesis, shown separately for the three analysis conditions. These plots show the probability density (using kernel density estimation) of the log Bayes factor derived from 200 bootstrap iterations for each analysis condition. The height of each plot indicates the full range of the data and the white marker indicates the mean. Positive values of the log Bayes factor correspond to evidence in favour of the non-monotonic plasticity hypothesis and negative values correspond to evidence against the hypothesis. (c) Histograms of scene–face classifier evidence during pre-switch (4–12 s; grey) and post-switch (16–20 s; green) intervals.
Figure 5
Figure 5. Relating classifier evidence on switch trials to working memory performance.
(a) Logistic regression fit (β1) of face, scene and scene–face classifier evidence versus response accuracy on switch trials from the Phase 2 delayed-recognition task. The left group represents switch trials during the pre-switch interval (4–12 s), the middle group represents switch trials during the post-switch interval (16–20 s) and the right group represents switch trials during the probe interval (20–24 s). Error bars are 95% bootstrap confidence intervals. (*P<0.05, 1,000 bootstrap samples, n=21). (b) Empirically derived estimates (generated using the P-CIT algorithm7) of the curve relating face evidence during the 20–24 s probe window and working memory accuracy, showing a positive, monotonic relationship. The graph conventions are as described in Fig. 4.

References

    1. Posner M. I. & Cohen Y. inAttention and Performance X: Control of Language Processes eds Bouma H., Bouwhuis D. G. 531–556Taylor & Francis, Inc. (1984).
    1. Posner M. I., Rafal R. D., Choate L. S. & Vaughan J. Inhibition of return: Neural basis and function. Cogn. Neuropsychol. 2, 211–228 (1985).
    1. Johnson M. R. et al.. Foraging for thought: an inhibition-of-return-like effect resulting from directing attention within working memory. Psychol. Sci. 24, 1104–1112 (2013). - PMC - PubMed
    1. Mayr U. & Keele S. W. Changing internal constraints on action: the role of backward inhibition. J. Exp. Psychol. Gen. 129, 4–26 (2000). - PubMed
    1. Mayr U. Inhibition of action rules. Psychon. Bull. Rev. 9, 93–99 (2002). - PubMed

Publication types