. 2015 Feb;22(2):200-12.
doi: 10.1128/CVI.00607-14. Epub 2014 Dec 17.

Measurement of phenotype and absolute number of circulating heparin-binding hemagglutinin, ESAT-6 and CFP-10, and purified protein derivative antigen-specific CD4 T cells can discriminate active from latent tuberculosis infection

Affiliations

Measurement of phenotype and absolute number of circulating heparin-binding hemagglutinin, ESAT-6 and CFP-10, and purified protein derivative antigen-specific CD4 T cells can discriminate active from latent tuberculosis infection

Paul Hutchinson et al. Clin Vaccine Immunol. 2015 Feb.

Abstract

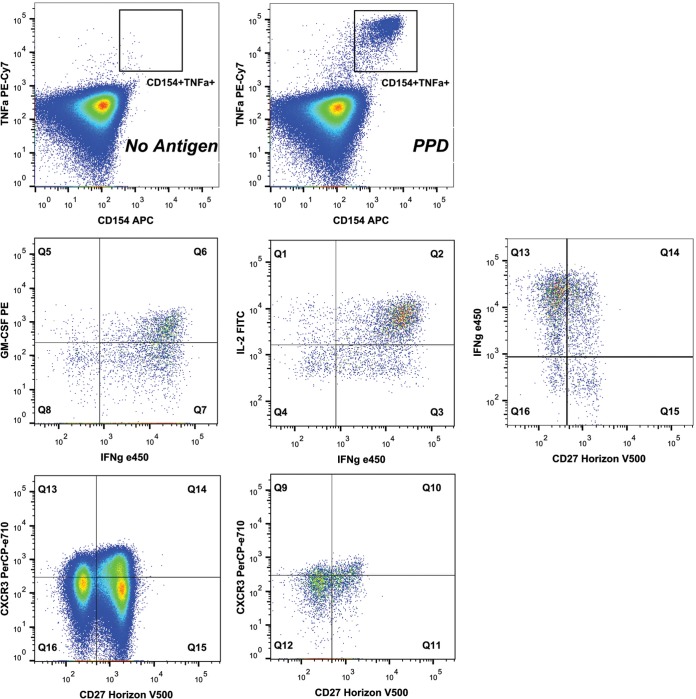
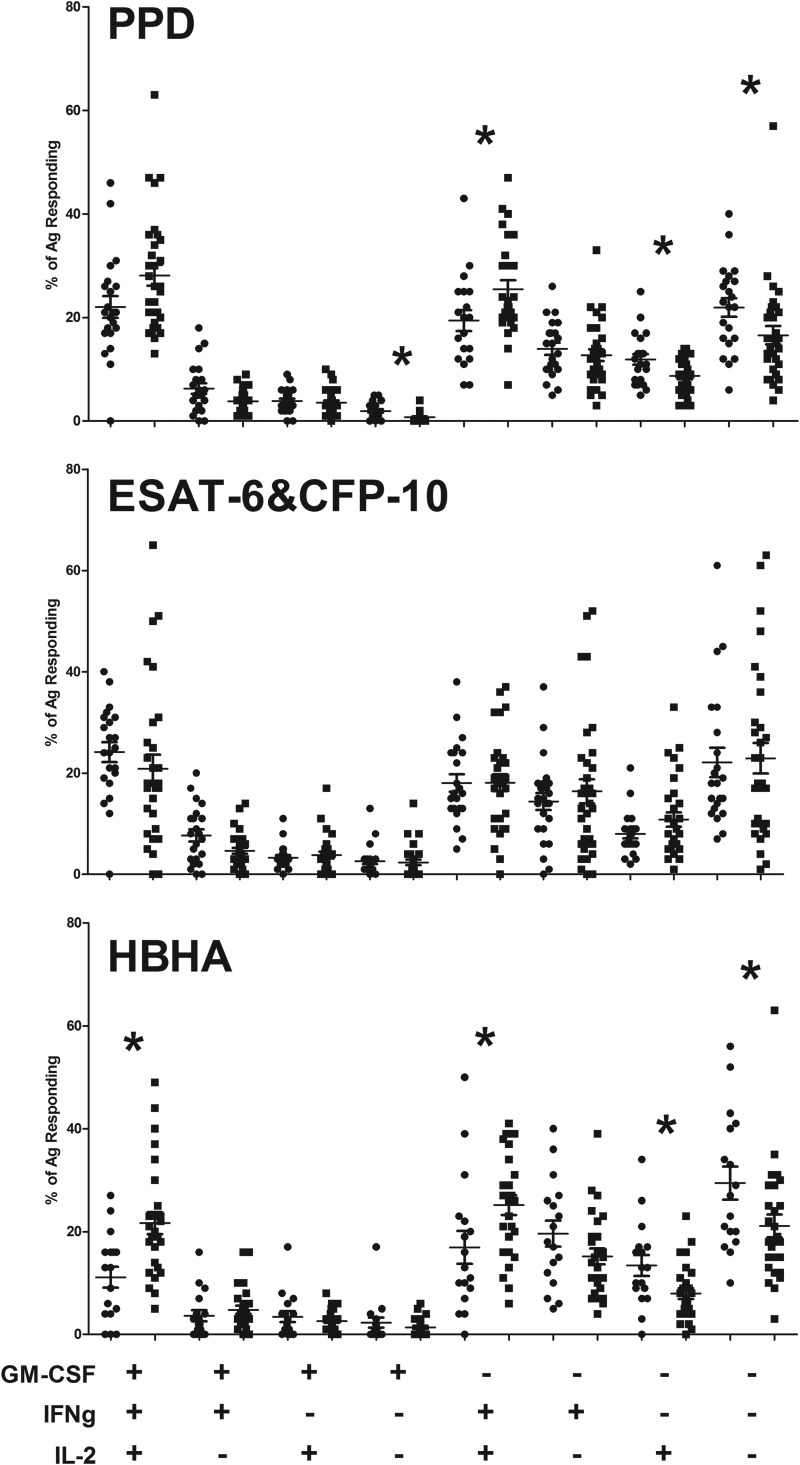
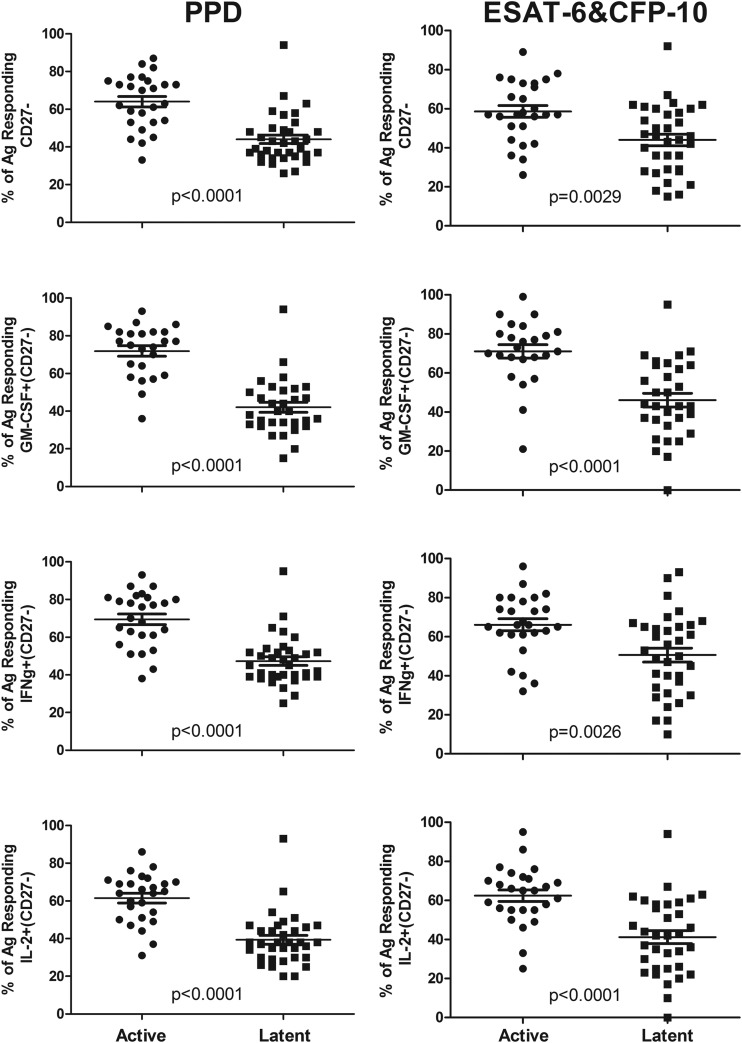
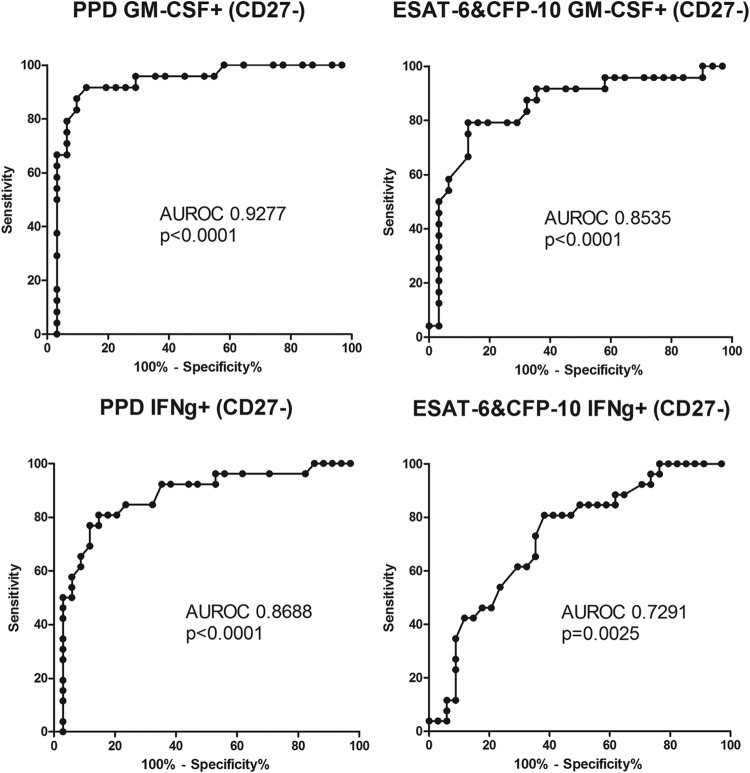
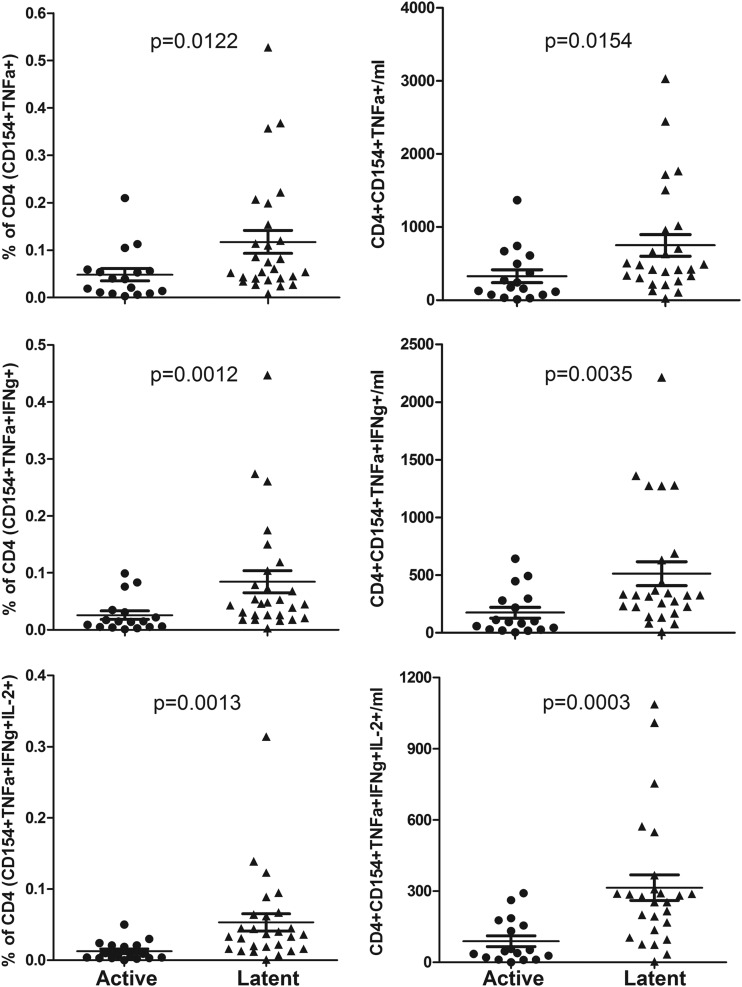
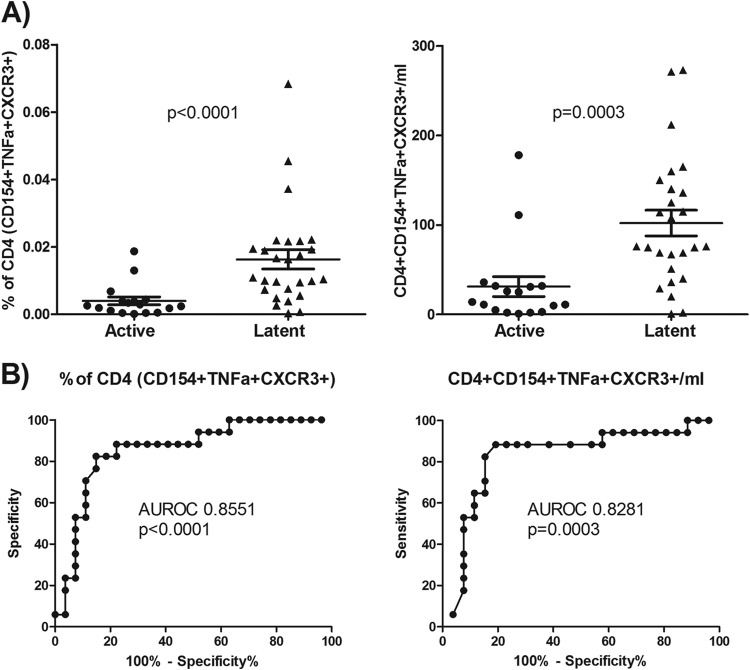
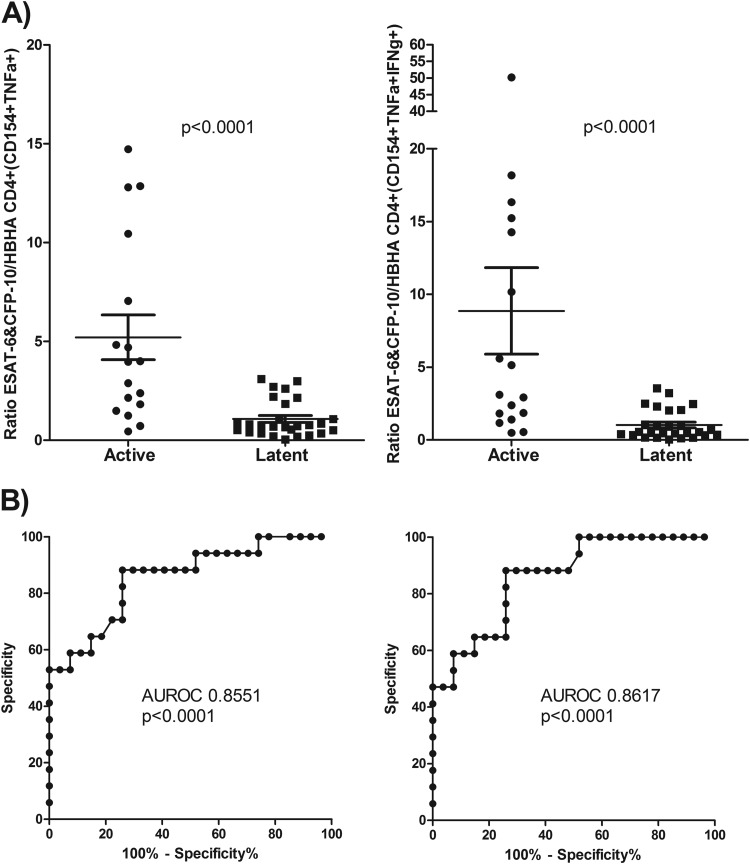
The tuberculin skin test (TST) and interferon gamma (IFN-γ) release assays (IGRAs) are used as adjunctive tests for the evaluation of suspected cases of active tuberculosis (TB). However, a positive test does not differentiate latent from active TB. We investigated whether flow cytometric measurement of novel combinations of intracellular cytokines and surface makers on CD4 T cells could differentiate between active and latent TB after stimulation with Mycobacterium tuberculosis-specific proteins. Blood samples from 60 patients referred to the Singapore Tuberculosis Control Unit for evaluation for active TB or as TB contacts were stimulated with purified protein derivative (PPD), ESAT-6 and CFP-10, or heparin-binding hemagglutinin (HBHA). The CD4 T cell cytokine response (IFN-γ, interleukin-2 [IL-2], interleukin-17A [IL-17A], interleukin-22 [IL-22], granulocyte-macrophage colony-stimulating factor [GM-CSF], and tumor necrosis factor alpha [TNF-α]) and surface marker expression (CD27, CXCR3, and CD154) were then measured. We found that the proportion of PPD-specific CD4 T cells, defined as CD154(+) TNF-α(+) cells that were negative for CD27 and positive for GM-CSF, gave the strongest discrimination between subjects with latent and those with active TB (area under the receiver operator characteristic [ROC] curve of 0.9277; P < 0.0001). Also, the proportions and absolute numbers of HBHA-specific CD4 T cells were significantly higher in those with latent TB infection, particularly CD154(+) TNF-α(+) IFN-γ(+) IL-2(+) and CD154(+) TNF-α(+) CXCR3(+). Finally, we found that the ratio of ESAT-6- and CFP-10-responding to HBHA-responding CD4 T cells was significantly different between the two study populations. In conclusion, we found novel markers of M. tuberculosis-specific CD4 cells which differentiate between active and latent TB.


Figures

FIG 1
FIG 1
Flow cytometric gating strategy. Representative flow cytometric plots for an individual subject are shown to detail the gating strategy used. The top row details the CD154+ TNF-α+ region for cells gated positive for CD3 and CD4 and negative for the dump channel (Live/Dead fixable dye positive and CD14+ CD16+ CD19+), stimulated with PPD or with no stimulus. The middle row details cytokine and CD27 staining on the PPD-stimulated cells positive for CD154 and TNF-α. The bottom row shows CD27 and CXCR3 staining on the total CD4 T cells (left) and the PPD-stimulated CD154+ TNF-α+ cells (right).
FIG 2
FIG 2
GM-CSF, IFN-γ, and IL-2 staining in M. tuberculosis antigen-specific cells. The measured percentages of responding cells for each subject (means and standard errors are shown) (circles, actively infected subjects; squares, latently infected subjects) for different combinations of GM-CSF, IFN-γ, and IL-2 staining are shown for the different M. tuberculosis antigens tested. An asterisk indicates significance at a P value of <0.05, as measured by the Mann-Whitney U test for comparisons between the actively and latently infected groups.
FIG 3
FIG 3
Proportions of CD27-negative PPD-responding and ESAT-6- and CFP-10-responding cells significantly differ between subjects with active and those with latent TB. The measured percentages of responding cells for each subject (means and standard errors are shown) that were CD27 are shown for total responding, GM-CSF+, IFN-γ+, or IL-2+ cells. (Left) PPD stimulation; (right) ESAT-6 and CFP-10 stimulation. Results for Mann-Whitney U test comparisons between the actively and latently infected groups are displayed.
FIG 4
FIG 4
ROC curve of the proportions of antigen-responding GM-CSF+ CD27 cells and antigen-responding IFN-γ+ CD27 cells. ROC analysis of the percentages of PPD-responding and ESAT-6- and CFP-10-responding cells was performed, and the respective areas under the ROC curve (AUROC) and P values are shown.
FIG 5
FIG 5
HBHA-responding cells as a percentage of CD4 cells and their absolute numbers. HBHA-responding cells as a percentage of CD4 cells (left) and absolute numbers (right) are shown for CD154+ TNF-α+ (total responding), CD154+ TNF-α+ IFN-γ+, and CD154+ TNF-α+ IFN-γ+ IL-2+ cells. Results for Mann-Whitney U test comparisons between the actively and latently infected groups are displayed.
FIG 6
FIG 6
CXCR3 expression on HBHA-responding cells. (A) CXCR3 expression on HBHA-responding cells as a percentage of CD4 cells (left) and their absolute numbers (right) for each subject. Results for Mann-Whitney U test comparisons between the actively and latently infected groups are displayed. (B) ROC analysis for HBHA-responding cells as a percentage of CD4 cells (left) and their absolute numbers (right), along with their respective areas under the curve and P values.
FIG 7
FIG 7
Comparison of HBHA responses and ESAT-6 and CFP-10 responses. (A) Ratio of the percentage of ESAT-6- and CFP-10-responding to HBHA-responding CD154+ TNF-α+ (left) and CD154+ TNF-α+ IFN-γ+ (right) CD4 cells for each subject. Results for Mann-Whitney U test comparisons between the actively and latently infected groups are displayed. (B) ROC analysis of the ratio of ESAT-6 and CFP-10 to HBHA for CD154+ TNF-α+ (left) and CD154+ TNF-α+ IFN-γ+ (right) cells, along with their respective areas under the curve and P values.

Similar articles

Cited by

References

    1. Flynn JL, Chan J. 2001. Immunology of tuberculosis. Annu Rev Immunol 19:93–129. doi:10.1146/annurev.immunol.19.1.93. - DOI - PubMed
    1. Waldrop SL, Pitcher CJ, Peterson DM, Maino VC, Picker LJ. 1997. Determination of antigen-specific memory/effector CD4+ T cell frequencies by flow cytometry: evidence for a novel, antigen-specific homeostatic mechanism in HIV-associated immunodeficiency. J Clin Invest 99:1739–1750. doi:10.1172/JCI119338. - DOI - PMC - PubMed
    1. Hughes AJ, Hutchinson P, Gooding T, Freezer NJ, Holdsworth SR, Johnson PD. 2005. Diagnosis of Mycobacterium tuberculosis infection using ESAT-6 and intracellular cytokine cytometry. Clin Exp Immunol 142:132–139. doi:10.1111/j.1365-2249.2005.02884.x. - DOI - PMC - PubMed
    1. Sester U, Fousse M, Dirks J, Mack U, Prasse A, Singh M, Lalvani A, Sester M. 2011. Whole-blood flow-cytometric analysis of antigen-specific CD4 T-cell cytokine profiles distinguishes active tuberculosis from non-active states. PLoS One 6:e17813. doi:10.1371/journal.pone.0017813. - DOI - PMC - PubMed
    1. Harari A, Rozot V, Enders FB, Perreau M, Stalder JM, Nicod LP, Cavassini M, Calandra T, Blanchet CL, Jaton K, Faouzi M, Day CL, Hanekom WA, Bart PA, Pantaleo G. 2011. Dominant TNF-alpha+ Mycobacterium tuberculosis-specific CD4+ T cell responses discriminate between latent infection and active disease. Nat Med 17:372–376. doi:10.1038/nm.2299. - DOI - PMC - PubMed

Publication types

MeSH terms