. 2015 Feb 7;282(1800):20141722.
doi: 10.1098/rspb.2014.1722.

Adenosine receptors mediate the hypoxic ventilatory response but not the hypoxic metabolic response in the naked mole rat during acute hypoxia

Affiliations

Adenosine receptors mediate the hypoxic ventilatory response but not the hypoxic metabolic response in the naked mole rat during acute hypoxia

Matthew E Pamenter et al. Proc Biol Sci. .

Abstract

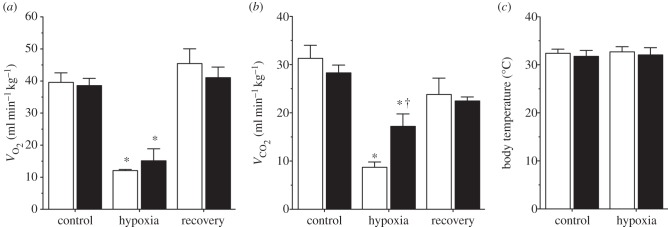
Naked mole rats are the most hypoxia-tolerant mammals identified; however, the mechanisms underlying this tolerance are poorly understood. Using whole-animal plethysmography and open-flow respirometry, we examined the hypoxic metabolic response (HMR), hypoxic ventilatory response (HVR) and hypoxic thermal response in awake, freely behaving naked mole rats exposed to 7% O₂ for 1 h. Metabolic rate and ventilation each reversibly decreased 70% in hypoxia (from 39.6 ± 2.9 to 12.1 ± 0.3 ml O₂ min(-1) kg(-1), and 1412 ± 244 to 417 ± 62 ml min(-1) kg(-1), respectively; p < 0.05), whereas body temperature was unchanged and animals remained awake and active. Subcutaneous injection of the general adenosine receptor antagonist aminophylline (AMP; 100 mg kg(-1), in saline), but not control saline injections, prevented the HVR but had no effect on the HMR. As a result, AMP-treated naked mole rats exhibited extreme hyperventilation in hypoxia. These animals were also less tolerant to hypoxia, and in some cases hypoxia was lethal following AMP injection. We conclude that in naked mole rats (i) hypoxia tolerance is partially dependent on profound hypoxic metabolic and ventilatory responses, which are equal in magnitude but occur independently of thermal changes in hypoxia, and (ii) adenosine receptors mediate the HVR but not the HMR.

Keywords: hypoxic metabolic response; hypoxic ventilatory response; plethysmography; respirometry; thermal response.


Figures

Figure 1.
Figure 1.
Metabolism is markedly reduced during acute hypoxia independently of ADO receptor activation. (a,b) Average metabolic rate in naked mole rats breathing normoxic or acute hypoxic (7% O2) gas mixtures and treated with subcutaneous saline (white bars) or AMP (black bars) injection. (c) Average body temperature from the animals treated in (a,b). Data are mean ± s.e.m. from n = 7 naked mole rats per group. Asterisks (*) indicate significant differences between normoxia and acute hypoxia values; daggers (†) indicate significant differences between AMP- and saline-treated animals (p < 0.05).
Figure 2.
Figure 2.
Ventilation is markedly reduced during acute hypoxia in an ADO receptor-dependent manner. Effects of acute hypoxia (7% O2), saline (white circles, dashed lines) and AMP (black squares, solid lines) on (a) total minute ventilation (formula image
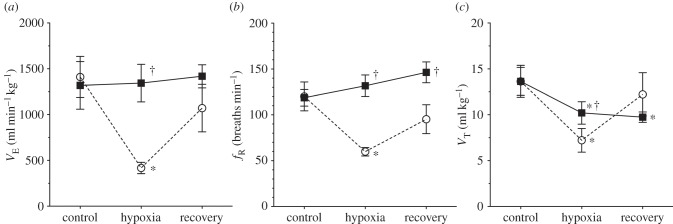
), (b) breathing frequency (f
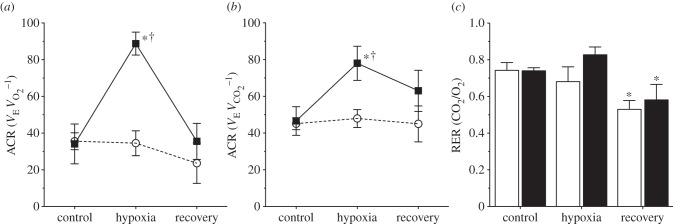
r) and (c) tidal volume (Vt) in naked mole rats. Data are mean ± s.e.m. from n = 7 naked mole rats per group. Asterisks (*) indicate significant differences between normoxia and acute hypoxia values; daggers (†) indicate significant differences between AMP- and saline-treated animals (p < 0.05).
Figure 3.
Figure 3.
Naked mole rats do not exhibit a hypoxic change in their air convection requirement (ACR). (a,b) ACR of naked mole rats breathing normoxic or acute hypoxic (7% O2) gas mixtures and treated with subcutaneous saline (white circles, dashed lines) or AMP (black squares, solid lines) injection. (c) Average RER values from the animals treated in (a,b). Data are mean ± s.e.m. from n = 7 naked mole rats per group. Asterisks (*) indicate significant differences between normoxia and acute hypoxia values; daggers (†) indicate significant differences between AMP- and saline-treated animals (p < 0.05).

References

    1. Buck LT, Pamenter ME. 2006. Adaptive responses of vertebrate neurons to anoxia: matching supply to demand. Respir. Physiol. Neurobiol. 154, 226–240. ( 10.1016/j.resp.2006.03.004) - DOI - PubMed
    1. Bickler PE, Buck LT. 2007. Hypoxia tolerance in reptiles, amphibians, and fishes: life with variable oxygen availability. Annu. Rev. Physiol. 69, 145–170. ( 10.1146/annurev.physiol.69.031905.162529) - DOI - PubMed
    1. Pamenter ME. 2014. Mitochondria: a multimodal hub of hypoxia tolerance. Can. J. Zool. 92, 569–589. ( 10.1139/cjz-2013-0247) - DOI
    1. Powell FL, Milsom WK, Mitchell GS. 1998. Time domains of the hypoxic ventilatory response. Respir. Physiol. 112, 123–134. ( 10.1016/S0034-5687(98)00026-7) - DOI - PubMed
    1. Barnes BM. 1989. Freeze avoidance in a mammal—body temperatures below 0 degrees C in an Arctic hibernator. Science 244, 1593–1595. ( 10.1126/science.2740905) - DOI - PubMed

Publication types

Substances