. 2014 Dec 17;6(267):267ra176.
doi: 10.1126/scitranslmed.3008411.

A Wnt-TGFβ2 axis induces a fibrogenic program in muscle stem cells from dystrophic mice

Affiliations

A Wnt-TGFβ2 axis induces a fibrogenic program in muscle stem cells from dystrophic mice

Stefano Biressi et al. Sci Transl Med. .

Abstract

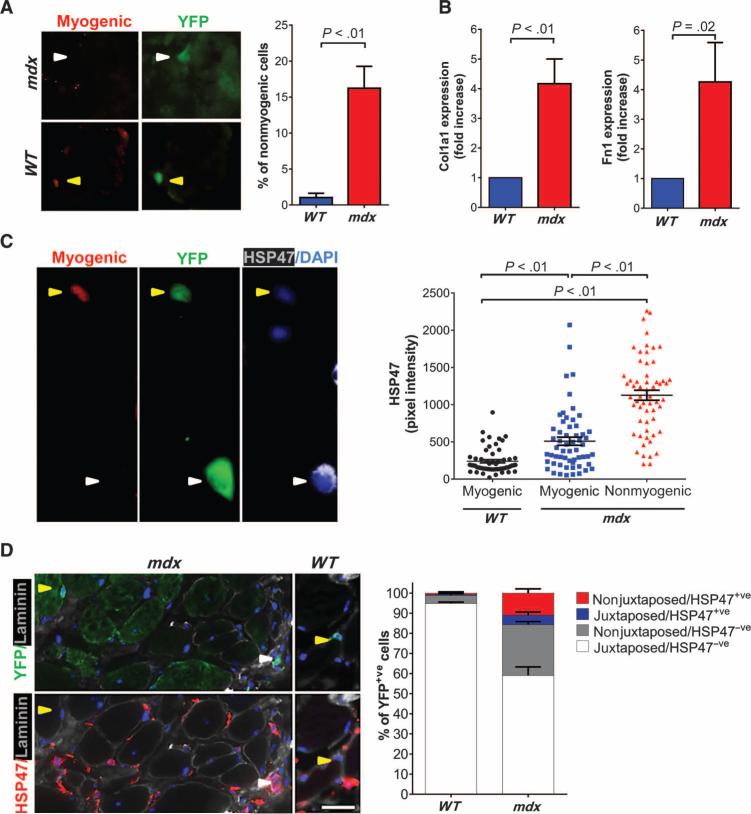
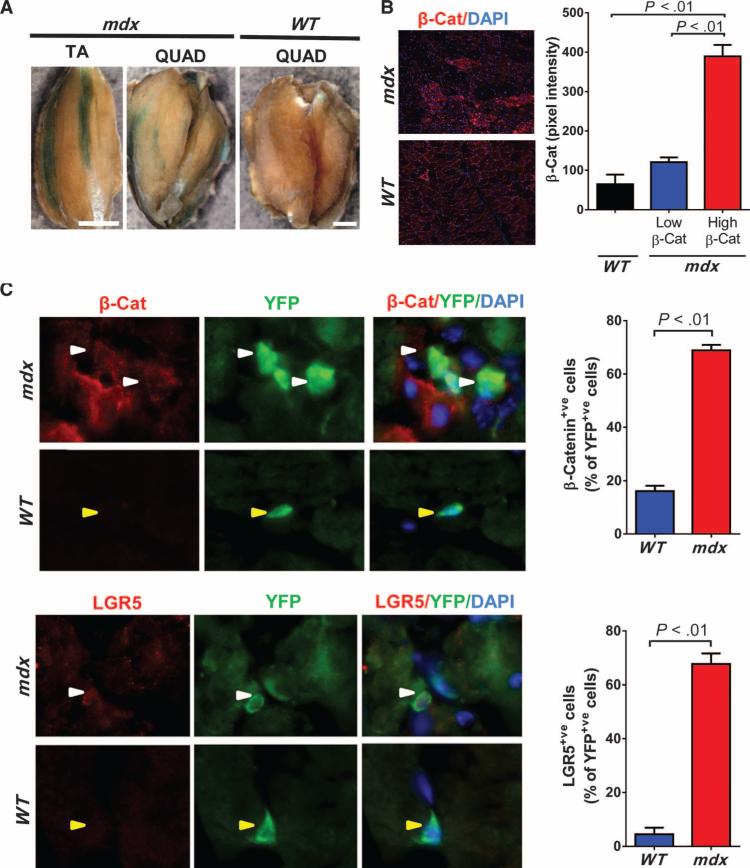
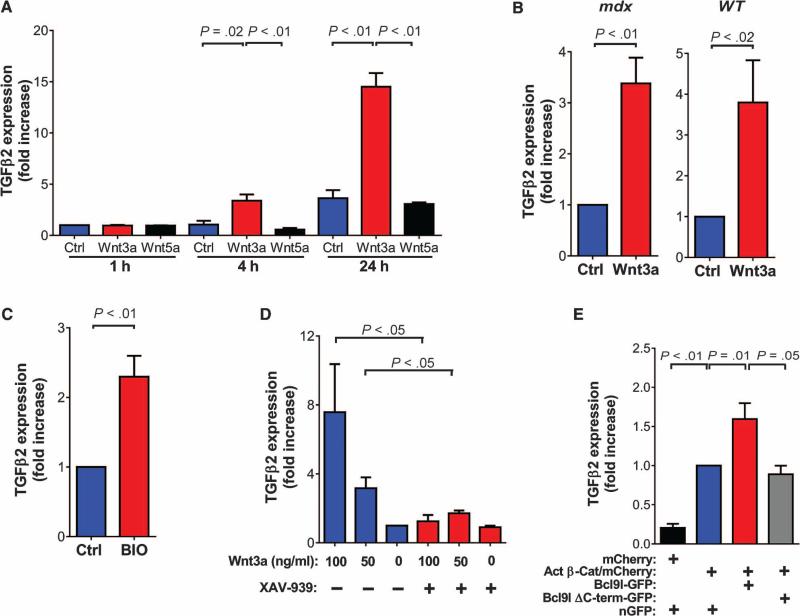
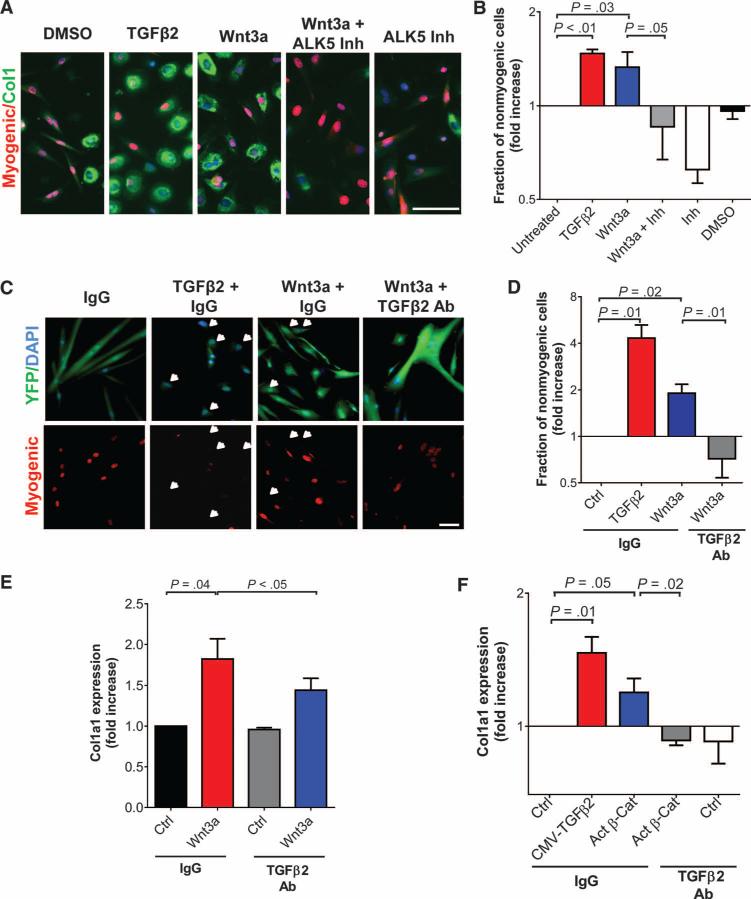
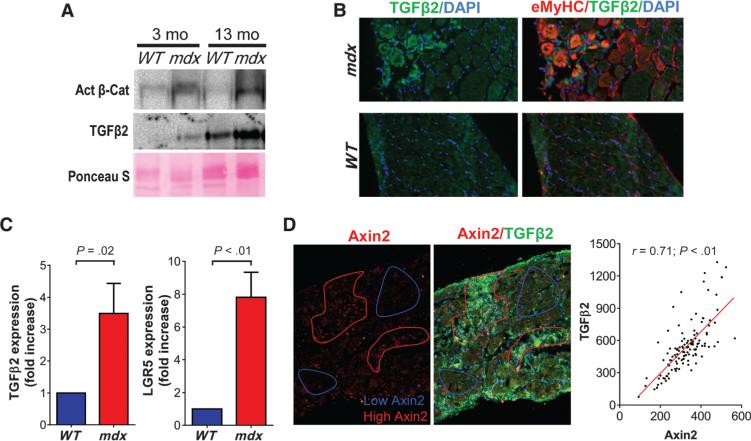
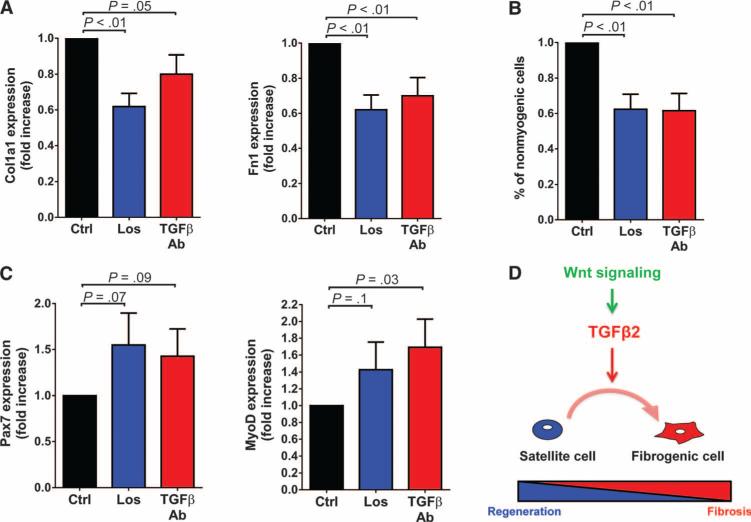
We have previously observed that Wnt signaling activates a fibrogenic program in adult muscle stem cells, called satellite cells, during aging. We genetically labeled satellite cells in a mouse model of Duchenne muscular dystrophy to follow their fate during the progression of the disease. We observed that a fraction of satellite cells had a reduced myogenic potential and showed enhanced expression of profibrotic genes compared to age-matched controls. By combining in vitro and in vivo results, we found that expression of transforming growth factor-β2 (TGFβ2) was induced in response to elevated canonical Wnt signaling in dystrophic muscles and that the resulting increase in TGFβ activity affected the behavior of satellite cells in an autocrine or paracrine fashion. Indeed, pharmacological inhibition of the TGFβ pathway in vivo reduced the fibrogenic characteristics of satellite cells. These studies shed new light on the cellular and molecular mechanisms responsible for stem cell dysfunction in dystrophic muscle and may contribute to the development of more effective and specific therapeutic approaches for the prevention of muscle fibrosis.


Figures

Fig. 1
Fig. 1. Influence of the dystrophic environment on muscle stem cells
(A) Representative images of diaphragms from a 12-month-old Pax7CreER;R26RYFP;mdx5Cv and Pax7CreER;R26RYFP;WT mouse were stained with a cocktail of antibodies recognizing the myogenic markers Pax7, MyoD, and myogenin and with an antibody to YFP. The percentage of YFP+ve cells that were nonmyogenic was quantified (N = 4). Examples of nonmyogenic YFP+ve and myogenic YFP+ve cells are indicated by white and yellow arrowheads, respectively. (B) Reverse transcription polymerase chain reaction (RT-PCR) analysis of the expression of the fibrotic genes Col1a1 and Fn1 in YFP+ve cells purified from hindlimb muscles of 8- to 12-month-old Pax7CreER;R26RYFP;mdx5Cv mice (N = 4). Data are expressed as fold increase of the expression in cells isolated from Pax7CreER;R26RYFP;WT age-matched mice (N = 4). (C) Cells isolated from diaphragm muscles of 18-month-old Pax7CreER;R26RYFP;mdx5Cv and Pax7CreER;R26RYFP;WT mice were stained for Pax7, MyoD, myogenin, YFP, and HSP47. Examples of myogenic and nonmyogenic YFP+ve cells are indicated by yellow and white arrowheads, respectively. The intensity of the staining for HSP47 was quantified and correlated with the presence of the myogenic markers. The analysis was performed on at least 50 cells from three independent experiments. DAPI, 4′,6-diamidino-2-phenylindole. (D) Left: Diaphragms of 12-month-old Pax7CreER;R26RYFP;mdx5Cv and Pax7CreER;R26RYFP;WT mice were stained with antibodies against YFP, HSP47, and laminin and were counterstained with DAPI for nuclei. Shown are examples of YFP+ve cells that are closely associated with myofibers (yellow arrowhead) or physically separated from myofibers (white arrowhead). Scale bar, 25 μm. Right: The percentage of YFP+ve cells in different locations relative to the fiber (juxtaposed or nonjuxtaposed) and their corresponding expression of HSP47 was quantified in WT and mdx mouse muscle (N = 3 for each genotype). Note that the fraction of nonjuxtaposed HSP47+ve cells were significantly more abundant in mdx5Cv than in WT mouse muscles (P < 0.01; unpaired one-tailed t test).
Fig. 2
Fig. 2. Enhanced Wnt signaling in dystrophic muscles
(A) Representative whole-mount X-gal staining of tibialis anterior (TA) and quadriceps (QUAD) muscles from 4-month-old BAT-GAL;mdx5Cv and BAT-GAL;WT mice. Scale bar, 2 mm. (B) β-Catenin (β-Cat) staining of muscles from 6-month-old mdx5Cv and WT mice (N = 3 for each genotype). The average intensity of the signal corresponding to β-catenin was evaluated in distinct regions of the muscles with high or low β-catenin+ve staining. Note that there was negligible β-catenin staining in muscles of WT mice. (C) The percentage of YFP+ve cells that were either β-catenin+ve or LGR5+ve was quantified in diaphragm sections of 12-month-old Pax7CreER;R26RYFP;mdx5Cv and Pax7CreER;R26RYFP;WT mice (N = 3 for each genotype). Examples of YFP+ve cells that were also either β-catenin+ve or LGR5+ve are indicated by white arrowheads; examples of YFP+ve cells that are also either β-catenin-ve or LGR5-ve are indicated by yellow arrowheads (DAPI nuclear stain, blue). P < 0.01; unpaired one-tailed t test.
Fig. 3
Fig. 3. Canonical Wnt signaling induces TGFβ2 expression in myogenic cells
(A) TGFβ2 was evaluated by RT-PCR in primary myoblasts (N = 3) after treatment with Wnt3a or Wnt5a (100 ng/ml). Data are expressed as fold increase of the expression in untreated control cells cultured for 1 hour (Ctrl). (B) TGFβ2 was evaluated by RT-PCR in YFP+ve cells purified by FACS from 12-month-old Pax7CreER;R26RYFP;mdx5Cv (N = 3) and Pax7CreER;R26RYFP;WT (N = 4) mice after treatment with Wnt3a (100 ng/ml). Data are expressed as fold increase of the expression in untreated control cells. (C and D) TGFβ2 was evaluated by RT-PCR in myoblasts treated for 24 hours (C) with BIO (1 μM) or (D) with XAV-939 (100 μM) in the presence of different concentrations of Wnt3a. Data are expressed as fold increase of the expression in untreated cells (N = 3 for all conditions). (E) TGFβ2 was evaluated by RT-PCR in myoblasts after transfection with the indicated vectors. The analysis was done on FACS-sorted mCherry+ve myoblasts to ensure a high efficiency of transfection. Data are expressed as fold increase in the expression in cells transfected with the active β-catenin (Act β-Cat)/mCherry– expressing plasmid (N = 3). P values are as indicated (unpaired one-tailed t test). nGFP, nuclear green fluorescent protein. C-term, C-terminal.
Fig. 4
Fig. 4. The Wnt-TGFβ2 axis influences muscle stem cell fate
(A and B) C2C12 myoblasts were cultured with or without TGFβ2 (10 ng/ml), Wnt3a (100 ng/ml), Wnt3a with addition of ALK5 inhibitor II (5 μM), or ALK5 inhibitor II (Inh) alone. To exclude myotubes, cultures of C2C12 cells were processed as described in Materials and Methods. (A) Cells were stained for myogenic markers (Pax7, MyoD, or myogenin) and Collagen1. (B) The measure of nonmyogenic cells was quantified and expressed as a fraction of untreated cells (logarithmic scale, N = 3). Scale bar, 25 μm. DMSO, dimethyl sulfoxide. (C and D) YFP+ve cells were isolated by FACS from Pax7CreER;R26RYFP;mdx5Cv mice, treated with Wnt3a or TGFβ2 in the presence of a TGFβ2-blocking antibody or control immunoglobulin G (IgG) (each at 12.5 μg/ml), and stained with a cocktail of muscle-specific antibodies (Pax7, MyoD, and myogenin). (C) Examples of nonmyogenic cells are indicated by white arrows. Scale bar, 50 μm. (D) Nonmyogenic cells were quantified and expressed as a fraction of IgG-treated cells (Ctrl) (logarithmic scale, N = 3). Ab, antibody. (E) RT-PCR analysis of the expression of Col1a1 and Axin2 in C2C12 myoblasts cultured with or without Wnt3a (100 ng/ml), with addition of a TGFβ2-blocking antibody or rabbit IgG (both at 12.5 μg/ml). Cells were processed as in (A). Data are expressed as fold increase of the expression in cells treated with IgG (N = 3 for each condition). (F) Primary myoblasts were cultured in conditioned medium from C2C12 myoblasts transfected with plasmids expressing mouse TGFβ2, active β-catenin/mCherry (Act β-Cat) or mCherry (Ctrl) and treated with either a TGFβ2-blocking antibody or a control antibody (each at 12.5 μg/ml) as described in Materials and Methods. The expression of Col1a1 was evaluated by RT-PCR. Data are expressed as fold increase in the expression in cells treated with IgG (logarithmic scale, N = 3). P values are as indicated (unpaired one-tailed t test). CMV, cytomegalovirus promoter.
Fig. 5
Fig. 5. Enhanced TGFβ signaling in dystrophic muscles correlates with increased Wnt activity
(A) Representative Western blots of active β-catenin and TGFβ2 in diaphragms of WT and mdx5Cv mice at the indicated ages. Ponceau S stain was used as a loading control. (B) Diaphragms of 6-month-old mdx5Cv and WT mice were stained with antibodies recognizing TGFβ2 and eMyHC. (C) RT-PCR analysis of transcript amounts of the Wnt target genes LGR5 and TGFβ2 in YFP+ve cells purified from hindlimb muscles of 8-to 12-month-old Pax7CreER;R26RYFP;mdx5Cv mice (N = 4). Data are expressed as fold increase in expression compared to that for age-matched Pax7CreER;R26RYFP;WT mice (N = 4). (D) Diaphragms of 6-month-old mdx5Cv mice were stained for TGFβ2 and Axin2, and the average intensity of each signal was evaluated in 120 randomly selected regions of the muscles (see Materials and Methods). The correlation between the values obtained for each staining in each region is shown. Linear regression is indicated. Pearson r, 0.71 (P < 0.01; two-tailed t test).
Fig. 6
Fig. 6. Inhibiting satellite cell fate change in mdx5Cv mice by blocking TGFβ signaling
(A) RT-PCR analysis of transcript amounts of Col1a1 and Fn1 in YFP+ve cells from hindlimb muscles of Pax7CreER; R26RYFP;mdx5Cv mice treated with losartan (Los) (N = 5) or with an antibody that blocked the activity of the three TGFβ isoforms, including TGFβ2 (N = 6). Data are expressed as fold increase in expression over respective controls. (B) YFP+ve cells were isolated from diaphragms of Pax7CreER;R26RYFP;mdx5Cv mice treated with losartan (N = 4) or a TGFβ-blocking antibody (N = 7) and stained for Pax7, MyoD, and myogenin. The percentage of nonmyogenic cells was quantified and expressed as fold increase over the percentage of nonmyogenic cells in control animals. (C) RT-PCR analysis of transcript amounts of Pax7 and MyoD as in (A). Data are expressed as fold increase in expression relative to controls. (D) Model of the mechanisms through which the Wnt-TGFβ2 axis may be affecting satellite cell fate.

References

    1. Chargé SB, Rudnicki MA. Cellular and molecular regulation of muscle regeneration. Physiol. Rev. 2004;84:209–238. - PubMed
    1. Dhawan J, Rando TA. Stem cells in postnatal myogenesis: Molecular mechanisms of satellite cell quiescence, activation and replenishment. Trends Cell Biol. 2005;15:666–673. - PubMed
    1. Zammit PS, Partridge TA, Yablonka-Reuveni Z. The skeletal muscle satellite cell: The stem cell that came in from the cold. J. Histochem. Cytochem. 2006;54:1177–1191. - PubMed
    1. Mauro A. Satellite cell of skeletal muscle fibers. J. Biophys. Biochem. Cytol. 1961;9:493–495. - PMC - PubMed
    1. Lepper C, Partridge TA, Fan CM. Development; An absolute requirement for Pax7-positive satellite cells in acute injury-induced skeletal muscle regeneration; 2011. pp. 3639–3646. - PMC - PubMed

Publication types

MeSH terms