. 2015 Mar;89(5):2698-709.
doi: 10.1128/JVI.03244-14. Epub 2014 Dec 17.

Modified vaccinia virus Ankara-infected dendritic cells present CD4+ T-cell epitopes by endogenous major histocompatibility complex class II presentation pathways

Affiliations

Modified vaccinia virus Ankara-infected dendritic cells present CD4+ T-cell epitopes by endogenous major histocompatibility complex class II presentation pathways

Frank Thiele et al. J Virol. 2015 Mar.

Abstract

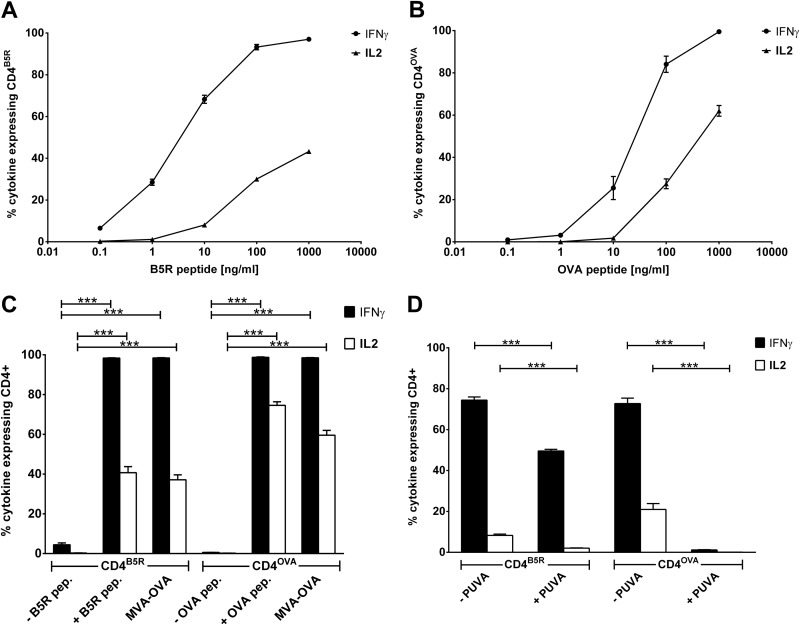
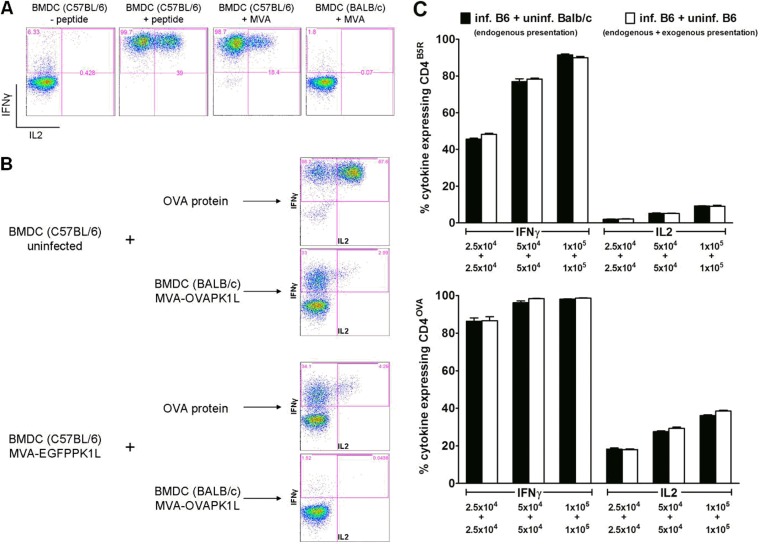
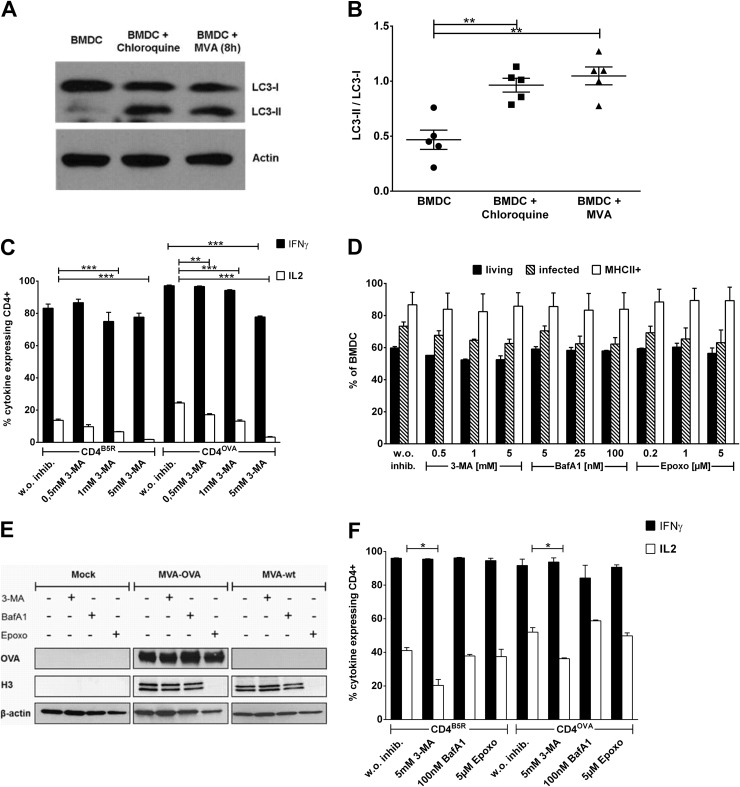
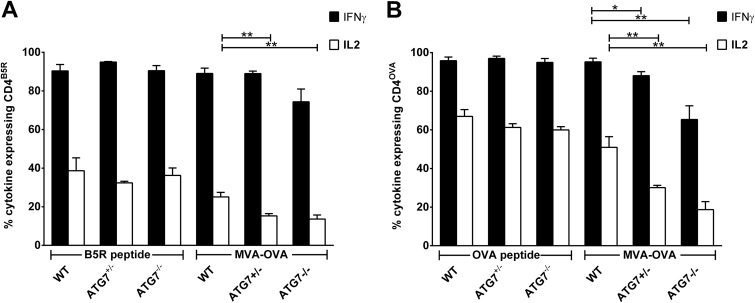
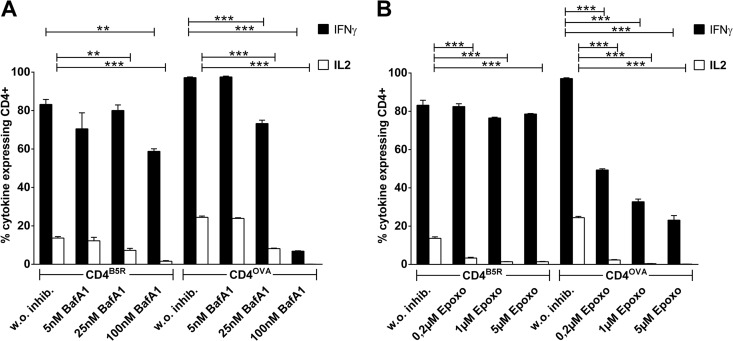
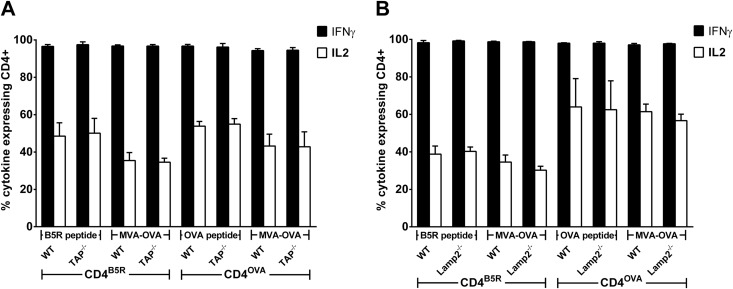
CD4(+) T lymphocytes play a central role in the immune system and mediate their function after recognition of their respective antigens presented on major histocompatibility complex II (MHCII) molecules on antigen-presenting cells (APCs). Conventionally, phagocytosed antigens are loaded on MHCII for stimulation of CD4(+) T cells. Certain epitopes, however, can be processed directly from intracellular antigens and are presented on MHCII (endogenous MHCII presentation). Here we characterized the MHCII antigen presentation pathways that are possibly involved in the immune response upon vaccination with modified vaccinia virus Ankara (MVA), a promising live viral vaccine vector. We established CD4(+) T-cell lines specific for MVA-derived epitopes as tools for in vitro analysis of MHCII antigen processing and presentation in MVA-infected APCs. We provide evidence that infected APCs are able to directly transfer endogenous viral proteins into the MHCII pathway to efficiently activate CD4(+) T cells. By using knockout mice and chemical inhibitory compounds, we further elucidated the molecular basis, showing that among the various subcellular pathways investigated, proteasomes and autophagy are key players in the endogenous MHCII presentation during MVA infection. Interestingly, although proteasomal processing plays an important role, neither TAP nor LAMP-2 was found to be involved in the peptide transport. Defining the molecular mechanism of MHCII presentation during MVA infection provides a basis for improving MVA-based vaccination strategies by aiming for enhanced CD4(+) T-cell activation by directing antigens into the responsible pathways.

Importance: This work contributes significantly to our understanding of the immunogenic properties of pathogens by deciphering antigen processing pathways contributing to efficient activation of antigen-specific CD4(+) T cells. We identified autophagosome formation, proteasomal activity, and lysosomal integrity as being crucial for endogenous CD4(+) T-cell activation. Since poxvirus vectors such as MVA are already used in clinical trials as recombinant vaccines, the data provide important information for the future design of optimized poxviral vaccines for the study of advanced immunotherapy options.


Figures

FIG 1
FIG 1
Simulation of CD4+ T-cell lines and presentation of virion-incorporated versus de novo-synthesized antigens. (A and B) Kinetics of cytokine expression of CD4+ T-cell lines. BMDCs were pulsed with different concentrations of peptide. CD4B5R (A) and CD4OVA (B) were added to the culture for 14 h, and the numbers of IFN-γ- and IL-2-expressing CD4+ T cells were quantified by ICS and FACS analysis. Data are means and SEM (n = 3, pooled from three experiments). (C) Recognition of infected BMDCs by CD4+ T-cell lines. BMDCs were treated with DMSO (− B5R pep. and − OVA pep.), pulsed with peptide (+ B5R pep. and + OVA pep.), or infected with MVA-OVA (MOI, 10). CD4B5R and CD4OVA were added to the culture for 14 h, and the numbers of IFN-γ- and IL-2-expressing CD4+ T cells were determined by ICS and FACS analysis. Data are means and SEM (n = 4, pooled from 3 experiments). (D) Presentation of virion-incorporated versus de novo-synthesized antigens. BMDCs were infected with MVA-OVA (MOI, 10) for 6 h. MVA was either pretreated with psoralen plus UVA (+ PUVA) for 30 min on ice or left untreated (− PUVA). CD4B5R and CD4OVA were added to the culture for 14 h, and the numbers of IFN-γ- and IL-2-expressing CD4+ T cells were quantified by ICS and FACS analysis. Data are means and SEM (n = 5, pooled from 3 experiments). ***, P ≤ 0.001 (unpaired t test, two tailed).
FIG 2
FIG 2
Validation of the cell culture system. (A) MHCII restriction of CD4+ T-cell lines. Peptide-pulsed or MVA-infected BMDCs from C57BL/6 and BALB/c mice were used as APCs for stimulation of CD4B5R. (B) Ability of uninfected and infected BMDCs to phagocytose soluble or cell-associated antigens. Uninfected or MVA-EGFP-infected (and sorted) BMDCs from C57BL/6 mice were incubated 5 h postinfection with full-length ovalbumin or were cocultured with MVA-OVA-infected MHC-mismatched BMDCs from BALB/c mice that have been additionally treated with psoralen plus UVA for 30 min 5 h postinfection to induce apoptosis. The ability to process and present soluble or cell-associated antigen on MHCII was assessed by analyzing the cytokine expression in CD4OVA cells that were added to these cultures for 14 h. (C) Determination of exogenous antigen presentation by uninfected cells in the cell culture system. Cocultures with equally increasing numbers of MVA-OVA/EGFP-infected and sorted BMDCs from C57BL/6 mice with uninfected BMDCs from either BALB/c mice (“inf. B6 + uninf. BALB/c” indicates endogenous presentation) or C57BL/6 mice (“inf. B6 + uninf. B6” indicates endogenous and exogenous presentation) were used for stimulation of CD4B5R and CD4OVA. The activation of both CD4+ T-cell lines after 14 h was analyzed by ICS and FACS analysis for IFN-γ and IL-2. Data are means and SEM (n = 3, pooled from three experiments). No significant differences (unpaired t test, two-tailed) were found between cocultures allowing only endogenous presentation and cultures allowing endogenous as well as exogenous presentation in all cell density-matched groups. All infections were performed with an MOI of 10.
FIG 3
FIG 3
Autophagy for endogenous MHCII presentation and effects of inhibitors on viability, infectibility, protein expression, and CD4+ T-cell activity. (A and B) MVA infection induces autophagy in BMDCs. (A) Western blot analysis revealed an increase of LC3-II in MVA-infected BMDCs (MOI, 10) compared to uninfected BMDCs (chloroquine treatment was used as a positive control). (B) The experiment whose results are presented in panel A was repeated 5 times (n = 5), and the increase in LC3-II/LC3-I ratio was quantified using Image J software. Error bars indicate SEM. (C) Inhibition of autophagy decreases endogenous MHCII presentation. BMDCs were treated with different concentrations of 3-MA followed by infection with MVA-OVA (MOI, 10). CD4B5R and CD4OVA were added to the culture for 14 h and the number of IFN-γ- and IL-2-expressing cells was quantified by ICS and FACS analysis. Data are means and SEM (n = 3, pooled from three experiments). (D) Inhibitors do not influence viability, infectibility, or MHCII expression in BMDCs. BMDCs were treated with the indicated inhibitors and then infected with MVA-OVA/EGFP (MOI, 10) for 6 h. Cells were subjected to live/dead staining and also stained for MHCII expression on their surfaces, and infection was assessed based on EGFP expression. FACS analysis was performed to quantify the percentage of cells that were living or infected or MHCII positive. (E) Inhibitors do not influence protein expression in BMDCs. BMDCs were treated with the indicated inhibitors (5 mM 3-MA, 100 nM BafA1, and 5 μM Epoxo) and then infected with MVA-OVA or MVA-wt (MOI, 10) for 14 h. Western blot analysis for expression of virus-derived ovalbumin and H3 was performed with β-actin as control. The blot is representative from three experiments. (F) 3-MA and epoxomicin exert a minimal effect on IL-2 expression in CD4+ T cells. BMDCs were treated with the indicated inhibitors (5 mM 3-MA, 100 nM BafA1, and 5 μM Epoxo) and pulsed with peptides. CD4B5R and CD4OVA were added to the culture for 14 h, and the numbers of IFN-γ- and IL-2-expressing CD4+ T cells were quantified by ICS and FACS analysis. Data are means and SEM (n = 3, pooled from three experiments). *, P ≤ 0.05; **, P ≤ 0.01; ***, P ≤ 0.001 (unpaired t test, two tailed).
FIG 4
FIG 4
ATG7-deficient BMDCs possess an impaired ability to stimulate CD4+ T cells after infection with MVA. BMDCs from either ATG7flox/flox CD11c-Cre−/− (WT), ATG7+/flox CD11c-Cre+/− (ATG7+/−) or ATG7flox/flox CD11c-Cre+/− mice (ATG7−/−) were pulsed with peptide or were infected with MVA-OVA (MOI, 1). CD4B5R (A) and CD4OVA (B) were added to the culture for 14 h, and the numbers of IFN-γ- and IL-2-expressing CD4+ T cells were determined by ICS and FACS analysis. Data are means and SEM (n = 5 pooled from at least three experiments). *, P ≤ 0.05; **, P ≤ 0.01 (unpaired t test, two-tailed).
FIG 5
FIG 5
Lysosomotropic agent and proteasome inhibitor decrease endogenous MHCII presentation. BMDCs were treated with different concentrations of bafilomycin A1 (BafA1) (A) or epoxomicin (B) and then infected with MVA-OVA (MOI, 10). CD4B5R and CD4OVA were added to the culture for 14 h, and the numbers of IFN-γ- and IL-2-expressing CD4+ T cells were quantified by ICS and FACS analysis. Data are means and SEM (n = 3, pooled from three experiments). **, P ≤ 0.01; ***, P ≤ 0.001 (unpaired t test, two-tailed).
FIG 6
FIG 6
TAP and LAMP-2 are not involved in endogenous MHCII presentation. BMDCs from TAP−/− mice (A) and Lamp-2−/− mice (B) were either pulsed with B5R or OVA peptide as a control or infected with MVA-OVA (MOI, 10). CD4B5R and CD4OVA were added to the culture for 14 h, and the numbers of IFN-γ- and IL-2-expressing CD4+ T cells were quantified by ICS and FACS analysis. Data are means and SEM (n = 4, pooled from at least 2 experiments). No significant differences (unpaired t test, two-tailed) were found for the stimulation of CD4+ T cells between WT and TAP−/− BMDCs and between WT and Lamp2−/− BMDCs in peptide-pulsed or MVA-OVA-infected groups for both CD4+ T-cell lines.

Similar articles

Cited by

References

    1. Trombetta ES, Mellman I. 2005. Cell biology of antigen processing in vitro and in vivo. Annu Rev Immunol 23:975–1028. doi:10.1146/annurev.immunol.22.012703.104538. - DOI - PubMed
    1. Andersen MH, Schrama D, thor Straten P, Becker JC. 2006. Cytotoxic T cells. J Investig Dermatol 126:32–41. doi:10.1038/sj.jid.5700001. - DOI - PubMed
    1. Zhu J, Paul WE. 2008. CD4 T cells: fates, functions, and faults. Blood 112:1557–1569. doi:10.1182/blood-2008-05-078154. - DOI - PMC - PubMed
    1. Weaver CT, Harrington LE, Mangan PR, Gavrieli M, Murphy KM. 2006. Th17: an effector CD4 T cell lineage with regulatory T cell ties. Immunity 24:677–688. doi:10.1016/j.immuni.2006.06.002. - DOI - PubMed
    1. Joffre OP, Segura E, Savina A, Amigorena S. 2012. Cross-presentation by dendritic cells. Nat Rev Immunol 12:557–569. doi:10.1038/nri3254. - DOI - PubMed

Publication types

Substances