. 2014 Dec 2:5:253.
doi: 10.3389/fneur.2014.00253. eCollection 2014.

A parametric approach to shape field-relevant blast wave profiles in compressed-gas-driven shock tube

Affiliations

A parametric approach to shape field-relevant blast wave profiles in compressed-gas-driven shock tube

Aravind Sundaramurthy et al. Front Neurol. .

Abstract

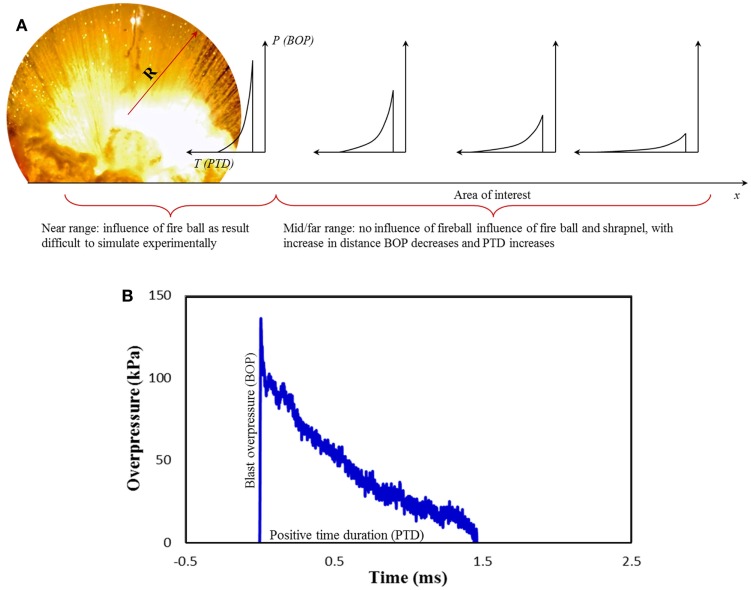
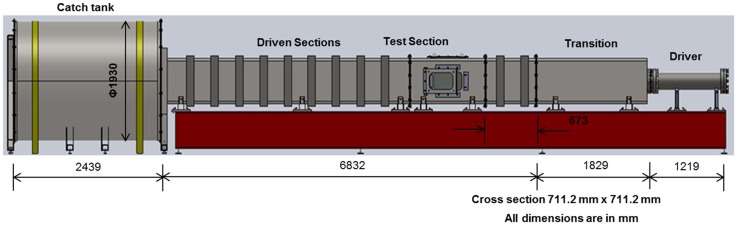
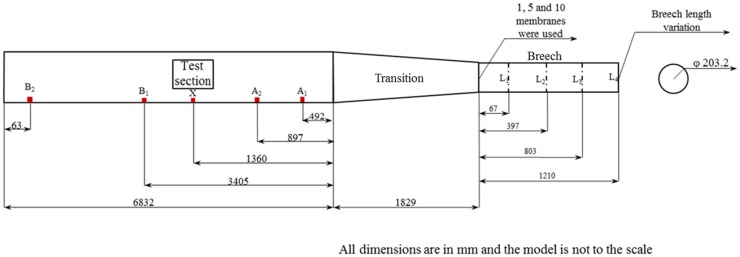
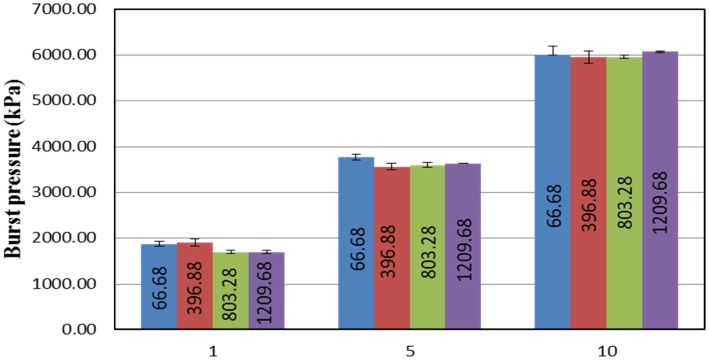
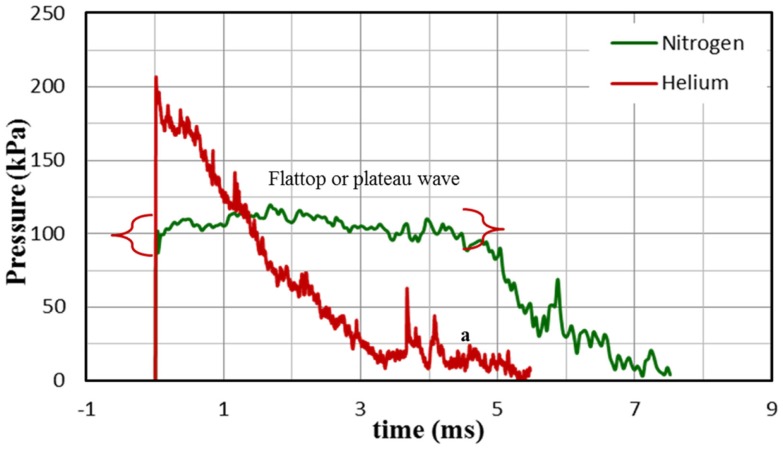
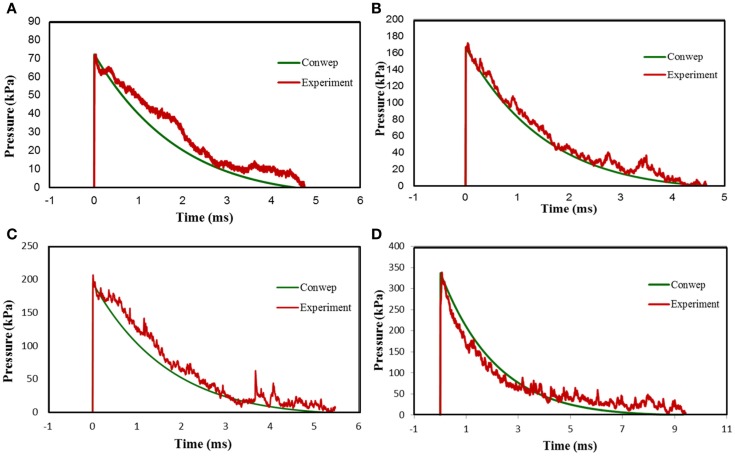
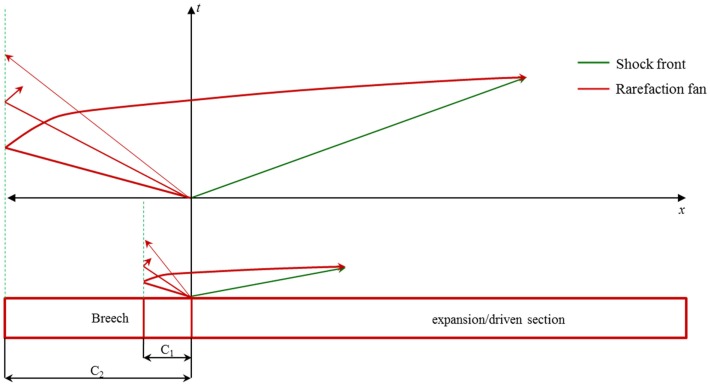
Detonation of a high-explosive produces shock-blast wave, shrapnel, and gaseous products. While direct exposure to blast is a concern near the epicenter, shock-blast can affect subjects, even at farther distances. When a pure shock-blast wave encounters the subject, in the absence of shrapnels, fall, or gaseous products the loading is termed as primary blast loading and is the subject of this paper. The wave profile is characterized by blast overpressure, positive time duration, and impulse and called herein as shock-blast wave parameters (SWPs). These parameters in turn are uniquely determined by the strength of high explosive and the distance of the human subjects from the epicenter. The shape and magnitude of the profile determine the severity of injury to the subjects. As shown in some of our recent works (1-3), the profile not only determines the survival of the subjects (e.g., animals) but also the acute and chronic biomechanical injuries along with the following bio-chemical sequelae. It is extremely important to carefully design and operate the shock tube to produce field-relevant SWPs. Furthermore, it is vital to identify and eliminate the artifacts that are inadvertently introduced in the shock-blast profile that may affect the results. In this work, we examine the relationship between shock tube adjustable parameters (SAPs) and SWPs that can be used to control the blast profile; the results can be easily applied to many of the laboratory shock tubes. Further, replication of shock profile (magnitude and shape) can be related to field explosions and can be a standard in comparing results across different laboratories. Forty experiments are carried out by judiciously varying SAPs such as membrane thickness, breech length (66.68-1209.68 mm), measurement location, and type of driver gas (nitrogen, helium). The effects SAPs have on the resulting shock-blast profiles are shown. Also, the shock-blast profiles of a TNT explosion from ConWep software is compared with the profiles obtained from the shock tube. To conclude, our experimental results demonstrate that a compressed-gas shock tube when designed and operated carefully can replicate the blast time profiles of field explosions accurately. Such a faithful replication is an essential first step when studying the effects of blast induced neurotrauma using animal models.

Keywords: blast induced neurotrauma; explosion modeling; primary blast injury; shock tube; shock tube adjustable parameters; shock wave parameters.


Figures

Figure 1
Figure 1
(A) shows evolution of shock-blast profile as the distance from the epicenter increases. Radius from epicenter with BOP higher than 1000 kPa is considered far range, which is very close to the fireball (R) and outside this radius it is mid and far field range, (B) Shock-blast wave profile generated from the explosion of 1.814 kg of C4 at a distance of 2.8 m.
Figure 2
Figure 2
711 mm × 711 mm Shock tube system. (Note: compressed gas is pumped into driver section in the right and the shock propagates from right to left in the figure.)
Figure 3
Figure 3
Experimental variables and sensor location; here, A1, A2, X, B1, and B2 are the side-on pressure sensors. Here, L1, L2, L3, and L4 are the breech lengths used in the experiment, A1, A2, X, B1, and B2 are the incident pressure sensor locations and 1, 5, and 10 are the number of membranes used.
Figure 4
Figure 4
Relationship between the number of membranes used and burst pressure produced with respect to different breech lengths. From this figure, it can be seen that there is no significant difference in the burst pressure with respect to the variations in the breech length. However, the burst pressure tends to increase with an increase in the number of membranes used.
Figure 5
Figure 5
Relationship between shock front Mach number and burst pressure for different breech lengths, there is linear relationship between Mach number and burst pressure (i.e., increase in membrane thickness).
Figure 6
Figure 6
Relationship between shock tube parameter burst pressure with overpressure measured in the test section for different breech lengths.
Figure 7
Figure 7
Relationship between positive time duration (PTD) and membrane thickness used for different breech lengths. It can be seen that there PTD increases with increase in the breech length for any given membrane configuration; furthermore, for a lower breech lengths, the PTD tends to increase with increase in the number of membranes used, however, this change reduces with increase in breech length. For the maximum breech length, there is no significant change in the PTD.
Figure 8
Figure 8
Describes the variation of shock-blast profile parameters along the length of the shock tube expansion section; all these experiments were performed for breech lengths 66.68 (black), 396.88 (red), 803.28 (blue), and 1209.68 (green) mm. (A–C) show the variation of overpressure along the length of the expansion section for burst pressures corresponding to 1, 5, and 10 membranes, respectively; (D–F) show the positive time duration along the expansion section for burst pressures corresponding to 1, 5, and 10 membranes, respectively; (G–I) show the positive impulse along the expansion section for burst pressures corresponding to 1, 5, and 10 membranes, respectively.
Figure 9
Figure 9
Comparison of the shock-blast profile for helium and nitrogen with 10 membranes and breech length of 1209.68 mm; clearly the wave profile corresponding to helium gas is a Friedlander wave and wave profile corresponding to nitrogen is a flat top wave.
Figure 10
Figure 10
Comparison of the shock-blast profiles from shock tube device and ConWep simulation software. (A) Comparison between shock-blast profile from a 10 membrane, 66.68 mm breech length shot with nitrogen as driver gas and 2.56 kg of TNT at 5.18 m, (B) comparison between shock-blast profile from a 8 membrane, 752.48 mm breech length shot with helium as driver gas and 7.68 kg of TNT at 5 m, (C) comparison between shock-blast profile from a 10 membrane, 1209.68 mm breech length shot with helium as driver gas and 14.08 kg of TNT at 5.7 m, (D) comparison between shock-blast profile from 15 membrane, 1209.68 mm breech length shot with helium as driver gas and 96 kg of TNT at 8.5 m.
Figure 11
Figure 11
x − t Diagram for compressed-gas shock tube. Here, a comparison was made between two driver lengths C1 and C2. Clearly, it can be seen that the expansion or rarefaction wave for C1 reaches earlier than C2.

References

    1. Chandra N, Holmberg A, Feng R. Controlling the Shape of the Shock Wave Profile in a Blast Facility. U.S. Provisional patent application no. 61542354 (2011).
    1. Sundaramurthy A, Alai A, Ganpule S, Holmberg A, Plougonven E, Chandra N. Blast-induced biomechanical loading of the rat: an experimental and anatomically accurate computational blast injury model. J Neurotrauma (2012) 29:2352–6410.1089/neu.2012.2413 - DOI - PubMed
    1. Skotak M, Wang F, Alai A, Holmberg A, Harris S, Switzer I, et al. Rat injury model under controlled field-relevant primary blast conditions: acute response to a wide range of peak overpressures. J Neurotrauma (2013) 30(13):1147–60.10.1089/neu.2012.2652 - DOI - PMC - PubMed
    1. Rafaels K. Blast Brain Injury Risk. [Doctoral dissertation Ph.D.]. Charlottesville, VA: University of Virginia; (2010).
    1. Svetlov SI, Prima V, Kirk DR, Gutierrez H, Curley KC, Hayes RL, et al. Morphologic and biochemical characterization of brain injury in a model of controlled blast overpressure exposure. J Trauma (2010) 69:795–804.10.1097/TA.0b013e3181bbd885 - DOI - PubMed