Review
. 2014 Dec 3:5:613.
doi: 10.3389/fimmu.2014.00613. eCollection 2014.

Stem cell transplantation as a dynamical system: are clinical outcomes deterministic?

Affiliations
Review

Stem cell transplantation as a dynamical system: are clinical outcomes deterministic?

Amir A Toor et al. Front Immunol. .

Abstract

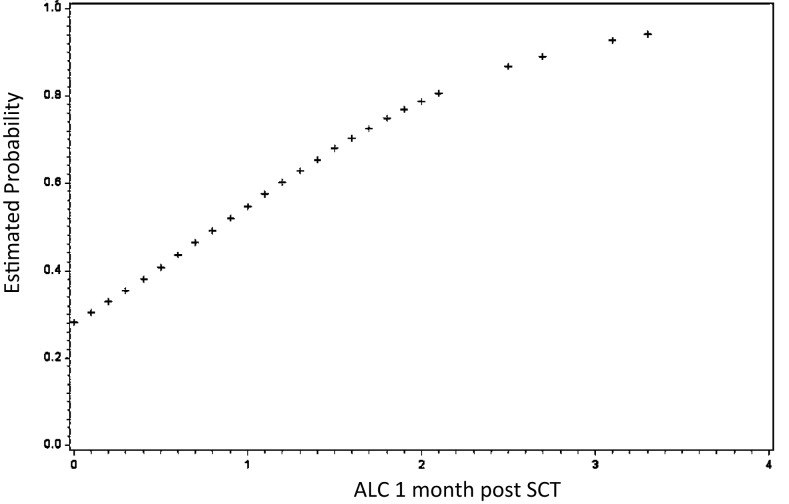
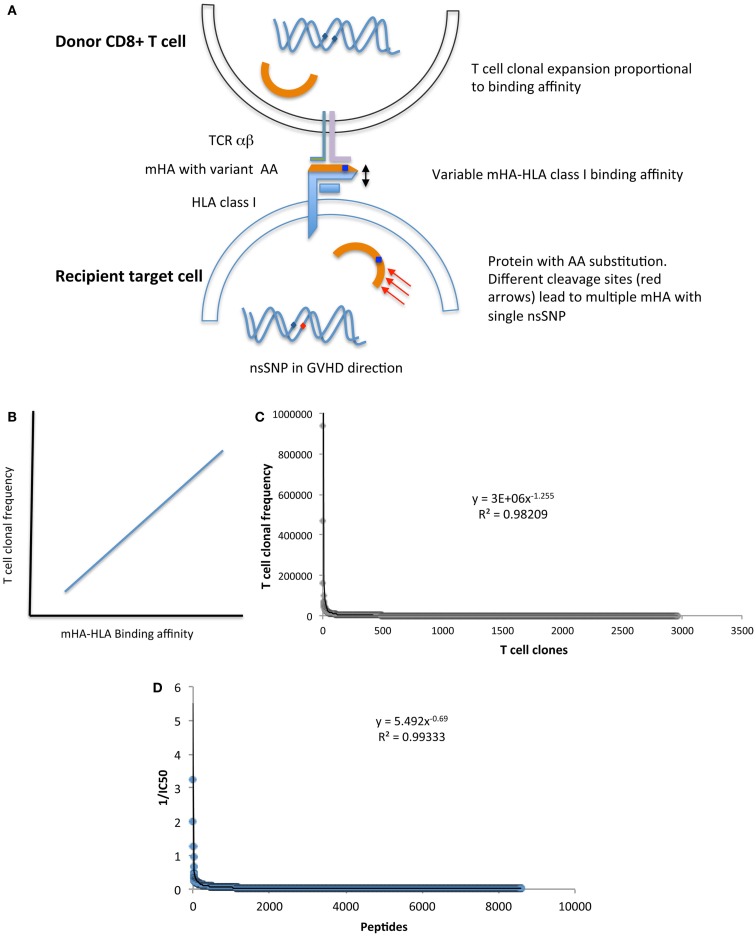
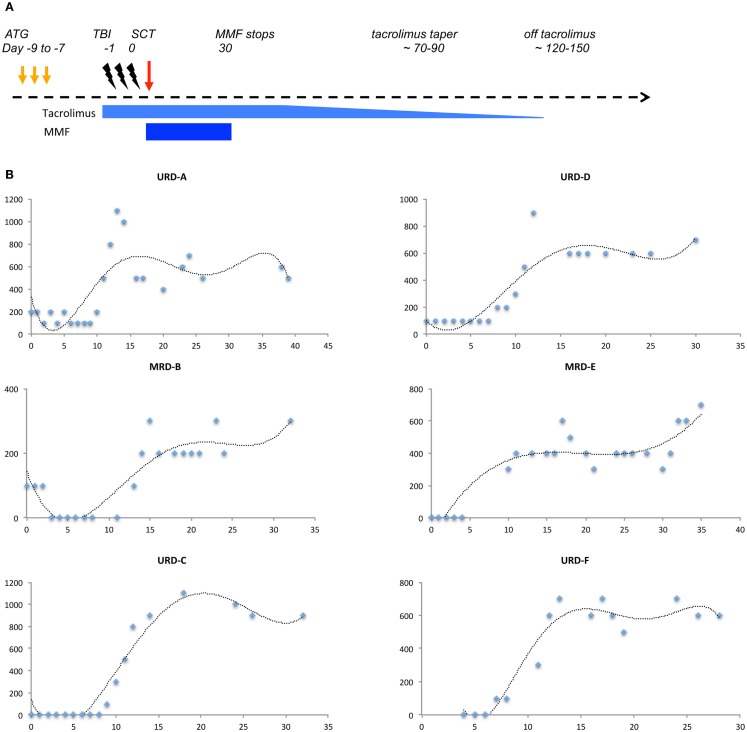
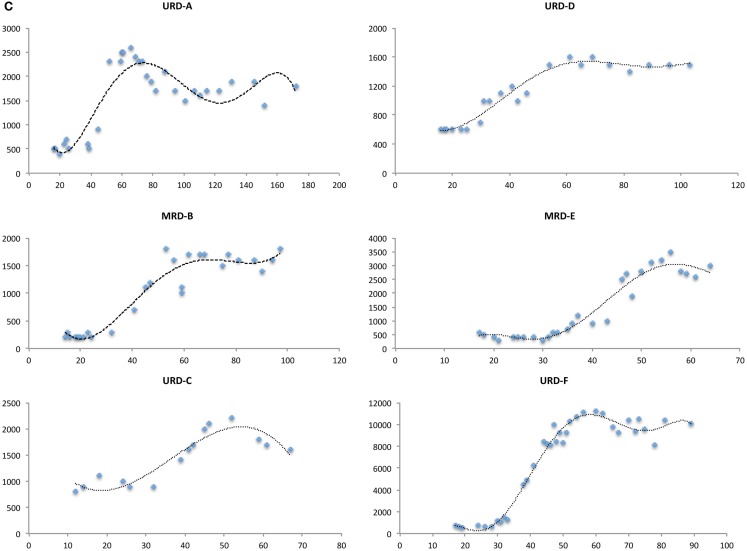
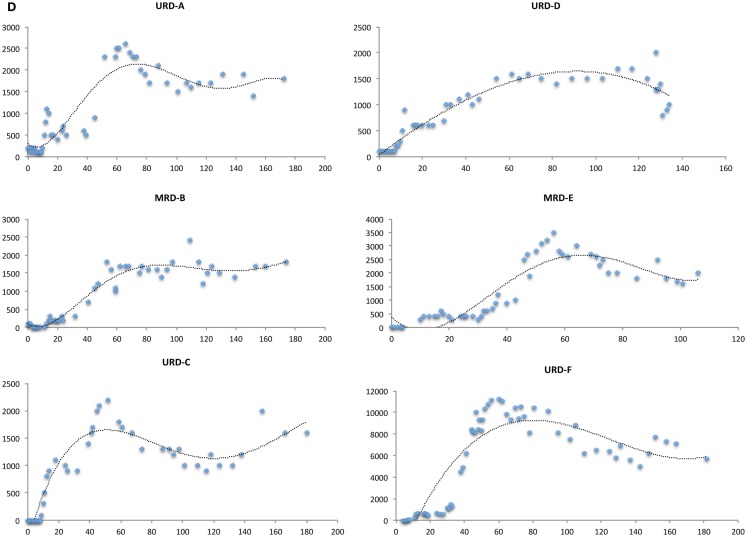
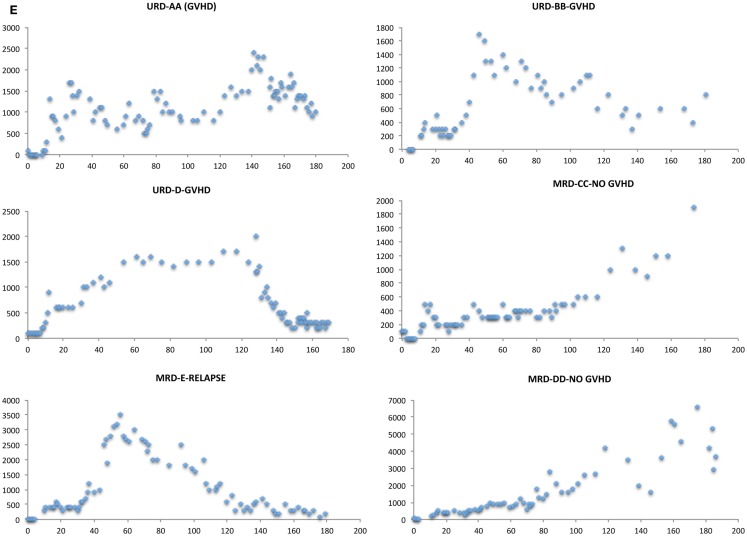
Outcomes in stem cell transplantation (SCT) are modeled using probability theory. However, the clinical course following SCT appears to demonstrate many characteristics of dynamical systems, especially when outcomes are considered in the context of immune reconstitution. Dynamical systems tend to evolve over time according to mathematically determined rules. Characteristically, the future states of the system are predicated on the states preceding them, and there is sensitivity to initial conditions. In SCT, the interaction between donor T cells and the recipient may be considered as such a system in which, graft source, conditioning, and early immunosuppression profoundly influence immune reconstitution over time. This eventually determines clinical outcomes, either the emergence of tolerance or the development of graft versus host disease. In this paper, parallels between SCT and dynamical systems are explored and a conceptual framework for developing mathematical models to understand disparate transplant outcomes is proposed.

Keywords: T cell repertoire; dynamical system; graft versus host disease; logistic function; stem cell transplantation.


Figures

Figure 1
Figure 1
Early lymphoid recovery influences clinical outcomes following allogeneic SCT. Absolute lymphocyte count (ALC) at 1 month predicts survival. As 1-month ALC increased by 1/10, the odds of survival increased by over 3% (HR = 3.25; 95% CI: 1.59–6.62; P = 0.001). Similarly, as 1-month ALC increased by 1/10, the odds of relapse decreased by over 3% (HR = 0.33; 95% CI: 0.16–0.66; P = 0.002) not shown. Adapted from Ref. (24).
Figure 2
Figure 2
(A) Model depicting the relationship between donor T cell clonal frequency and recipient mHA-HLA binding affinity. (B) Postulated association between peptide-HLA binding affinity and T cell clonal frequency distribution. (C) T cell clonal frequency distribution1 and (D) the values of reciprocal of IC502 (mHA-HLA binding affinity estimate) for mHA-HLA in a single DRP. Both parameters follow a Power law distribution, suggesting that peptide-HLA affinity spectrum has an important role in determining T cell repertoire. Footnotes:1 T cell clonal frequency measured on day 100 post SCT, by high throughput sequencing of T cell receptor β, cDNA obtained from CD3+ cells, given in copy number of unique clones and arranged in descending order with a cutoff at <100 copies. 21/IC50 of mHA-HLA complexes-(estimate of the binding affinity), determined by whole exome sequencing to identify nsSNPs between donor and recipient in the GVH direction, followed by in silico determination of the resulting oligopeptide sequence, and the IC50 of the resulting mHA-HLA complexes.
Figure 3
Figure 3
Modeling stem cell transplantation as a dynamical system. Iterative expansion of donor T cells clones over time in the presence of an alloreactivity potential, modulated by the degree of antigen presentation. In (A) cells colored red, represent alloreactive T cell clones, and green cells, other non-alloreactive T cell clones. Allo-antigen exposure or lack thereof in the first few days of transplant results in minor early differences in the repopulating T cell clones, which over time results in an exponential expansion of corresponding T cell clones. Different phases of cellular proliferation are labeled 1, 2, 3, and 4 in the schema and extrapolated to the plots depicting absolute lymphocyte counts from two patients following SCT (B). These plots show a bi-logistic growth pattern, reflecting initial engraftment and cessation of mycophenolate mofetil following SCT.
Figure 4
Figure 4
Absolute lymphocyte count (ALC, μL−1) plotted as a function of time (days following transplant). (A) Schema of the transplant protocol, outlining the general immunosuppression withdrawal scheme. (B) ALC in the first month following SCT shows the first growth phase coincident with engraftment. (C) ALC in the second and third month following SCT shows the second exponential growth phase following cessation of MMF, of these patients only patient D developed GVHD. (D) ALC in the first 4–6 month following SCT shows the overall growth kinetics of lymphocytes. Data in all these plots may be modeled with a logistic equation of the general form, Nt = K/(1 + Aert), where A = (K − N0)/N0, where N0 represents the lymphocyte count at the beginning, and Nt is the lymphocyte count at time t following transplant, e is the base of natural logarithms, 2.718 and r is the growth rate of the population. A similar equation, Nt = N0 + (K − N0)/(1 + 10(a−t)r), where a, is the time at which growth rate is maximal and an inflection point is observed in the logistic curve, also describes the data. (E) Patients with clinical events, depicting impact of immunosuppressive therapy on lymphocyte counts, and departure from the sigmoid growth patterns. Also, seen is the variability from measurement to measurement in ALC in the fourth month, when comparing patients with GVHD (AA and D) and those without (CC and DD).
Figure 4
Figure 4
Absolute lymphocyte count (ALC, μL−1) plotted as a function of time (days following transplant). (A) Schema of the transplant protocol, outlining the general immunosuppression withdrawal scheme. (B) ALC in the first month following SCT shows the first growth phase coincident with engraftment. (C) ALC in the second and third month following SCT shows the second exponential growth phase following cessation of MMF, of these patients only patient D developed GVHD. (D) ALC in the first 4–6 month following SCT shows the overall growth kinetics of lymphocytes. Data in all these plots may be modeled with a logistic equation of the general form, Nt = K/(1 + Aert), where A = (K − N0)/N0, where N0 represents the lymphocyte count at the beginning, and Nt is the lymphocyte count at time t following transplant, e is the base of natural logarithms, 2.718 and r is the growth rate of the population. A similar equation, Nt = N0 + (K − N0)/(1 + 10(a−t)r), where a, is the time at which growth rate is maximal and an inflection point is observed in the logistic curve, also describes the data. (E) Patients with clinical events, depicting impact of immunosuppressive therapy on lymphocyte counts, and departure from the sigmoid growth patterns. Also, seen is the variability from measurement to measurement in ALC in the fourth month, when comparing patients with GVHD (AA and D) and those without (CC and DD).

References

    1. Horowitz MM, Gale RP, Sondel PM, Goldman JM, Kersey J, Kolb HJ, et al. Graft-versus-leukemia reactions after bone marrow transplantation. Blood (1990) 75:555–62. - PubMed
    1. Kolb HJ, Schattenberg A, Goldman JM, Hertenstein B, Jacobsen N, Arcese W, et al. Graft-versus-leukemia effect of donor lymphocyte transfusions in marrow grafted patients. Blood (1995) 86:2041–50. - PubMed
    1. Lee SJ, Klein J, Haagenson M, Baxter-Lowe LA, Confer DL, Eapen M, et al. High-resolution donor-recipient HLA matching contributes to the success of unrelated donor marrow transplantation. Blood (2007) 110:4576–83.10.1182/blood-2007-06-097386 - DOI - PubMed
    1. Valcárcel D, Sierra J, Wang T, Kan F, Gupta V, Hale GA, et al. One-antigen mismatched related versus HLA-matched unrelated donor hematopoietic stem cell transplantation in adults with acute leukemia: Center for International Blood and Marrow Transplant Research results in the era of molecular HLA typing. Biol Blood Marrow Transplant (2011) 17:640–8.10.1016/j.bbmt.2010.07.022 - DOI - PMC - PubMed
    1. Arora M, Weisdorf DJ, Spellman SR, Haagenson MD, Klein JP, Hurley CK, et al. HLA-identical sibling compared with 8/8 matched and mismatched unrelated donor bone marrow transplant for chronic phase chronic myeloid leukemia. J Clin Oncol (2009) 27:1644–5210.1200/JCO.2008.18.7740 - DOI - PMC - PubMed

LinkOut - more resources