. 2014 Nov 19;7(1):70.
doi: 10.1186/s13039-014-0070-y. eCollection 2014.

Localized, non-random differences in chromatin accessibility between homologous metaphase chromosomes

Affiliations

Localized, non-random differences in chromatin accessibility between homologous metaphase chromosomes

Wahab A Khan et al. Mol Cytogenet. .

Abstract

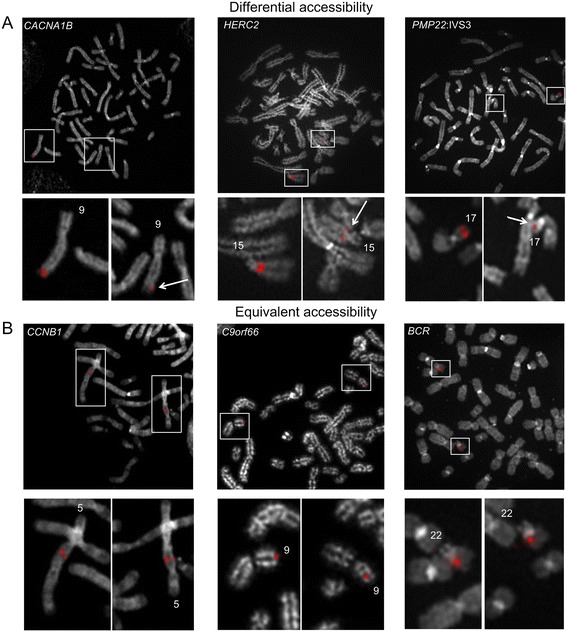
Background: Condensation differences along the lengths of homologous, mitotic metaphase chromosomes are well known. This study reports molecular cytogenetic data showing quantifiable localized differences in condensation between homologs that are related to differences in accessibility (DA) of associated DNA probe targets. Reproducible DA was observed for ~10% of locus-specific, short (1.5-5 kb) single copy DNA probes used in fluorescence in situ hybridization.

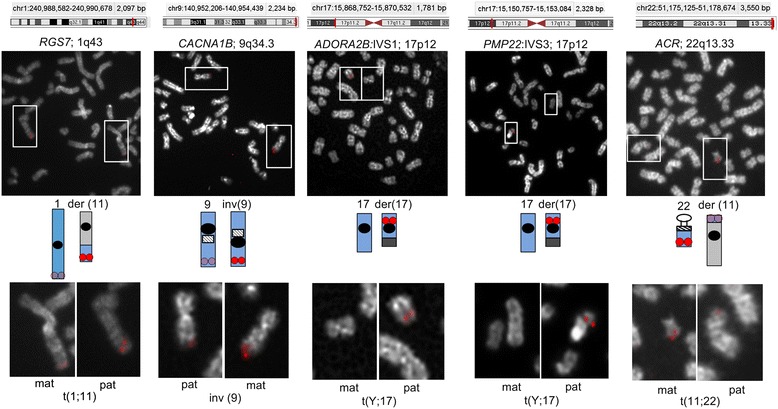
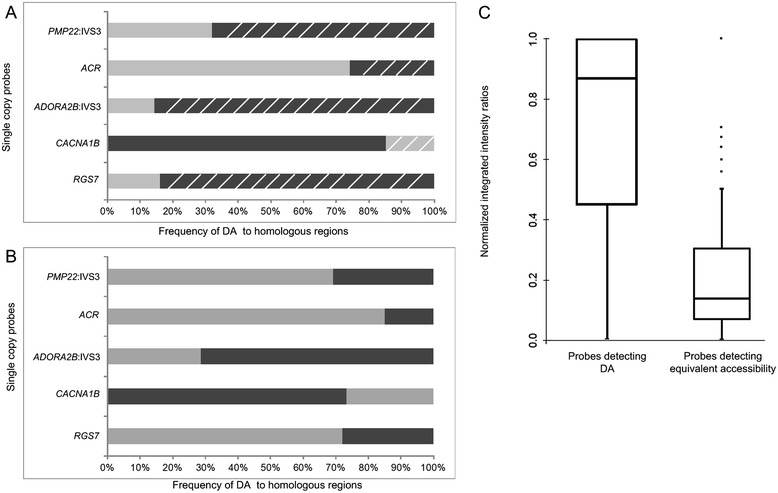
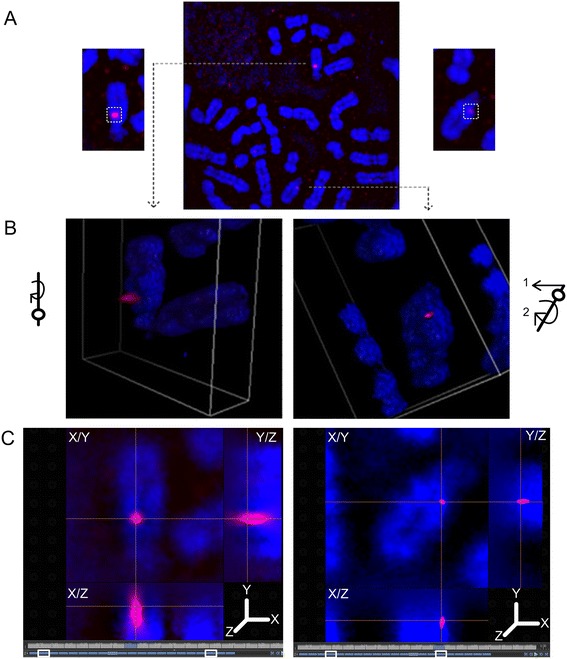
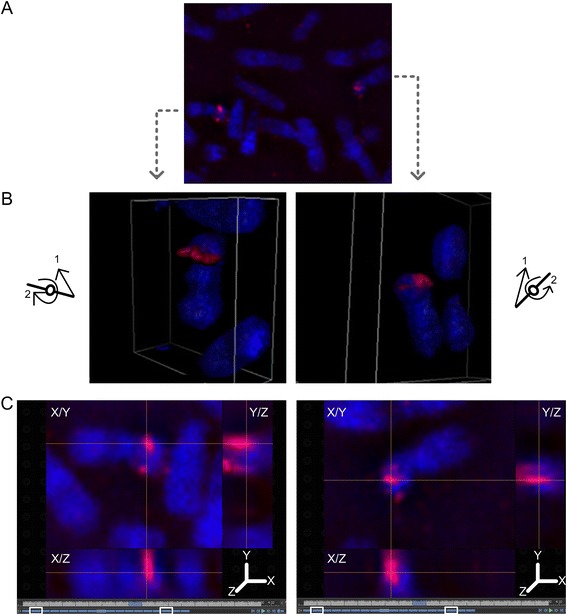
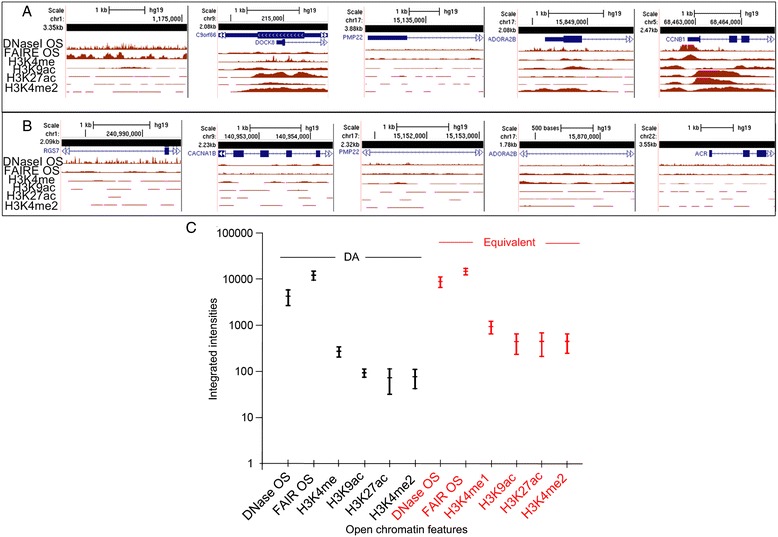
Results: Fourteen probes (from chromosomes 1, 5, 9, 11, 15, 17, 22) targeting genic and intergenic regions were developed and hybridized to cells from 10 individuals with cytogenetically-distinguishable homologs. Differences in hybridization between homologs were non-random for 8 genomic regions (RGS7, CACNA1B, GABRA5, SNRPN, HERC2, PMP22:IVS3, ADORA2B:IVS1, ACR) and were not unique to known imprinted domains or specific chromosomes. DNA probes within CCNB1, C9orf66, ADORA2B:Promoter-Ex1, PMP22:IVS4-Ex 5, and intergenic region 1p36.3 showed no DA (equivalent accessibility), while OPCML showed unbiased DA. To pinpoint probe locations, we performed 3D-structured illumination microscopy (3D-SIM). This showed that genomic regions with DA had 3.3-fold greater volumetric, integrated probe intensities and broad distributions of probe depths along axial and lateral axes of the 2 homologs, compared to a low copy probe target (NOMO1) with equivalent accessibility. Genomic regions with equivalent accessibility were also enriched for epigenetic marks of open interphase chromatin (DNase I HS, H3K27Ac, H3K4me1) to a greater extent than regions with DA.

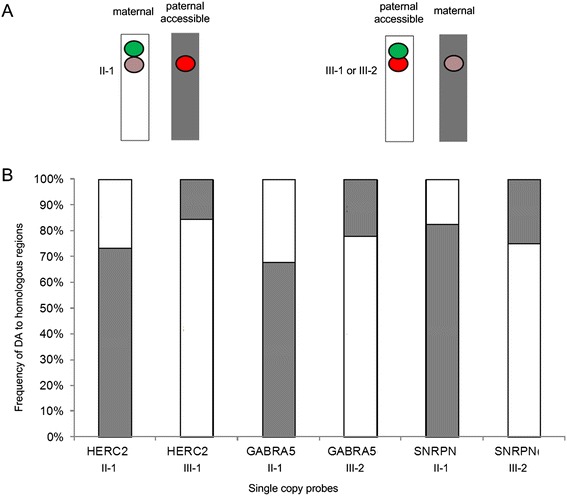
Conclusions: This study provides evidence that DA is non-random and reproducible; it is locus specific, but not unique to known imprinted regions or specific chromosomes. Non-random DA was also shown to be heritable within a 2 generation family. DNA probe volume and depth measurements of hybridized metaphase chromosomes further show locus-specific chromatin accessibility differences by super-resolution 3D-SIM. Based on these data and the analysis of interphase epigenetic marks of genomic intervals with DA, we conclude that there are localized differences in compaction of homologs during mitotic metaphase and that these differences may arise during or preceding metaphase chromosome compaction. Our results suggest new directions for locus-specific structural analysis of metaphase chromosomes, motivated by the potential relationship of these findings to underlying epigenetic changes established during interphase.

Keywords: 3-D super resolution microscopy; Allelic differences; Differential chromatin accessibility; Homologous chromosome structure; Human mitotic chromosomes; Metaphase single copy FISH; Molecular cytogenetics.


Figures

Figure 1
Figure 1
Differential accessibility and equivalent accessibility patterns between metaphase chromosome homologs detected by single copy probes. A. Human chromosomes hybridized with single copy FISH probes developed from CACNA1B (2.23 kb), HERC2 (1.81 kb), and PMP22:IVS3 (2.32 kb) (left to right) show differential hybridization between homologs. Arrows indicate the homolog with less fluorescence (or less accessibility). B. Examples of human cells with single copy FISH probes developed from within CCNB1 (2.47 kb), C9orf66 (2.08 kb), and BCR (3.4 kb) (left to right) that show similar fluorescence intensities (or equivalent accessibility) between homologous regions. Chromosomes were counterstained with DAPI (converted to gray scale in image) and probes were labelled with digoxigenin d-UTP and detected with Cy3 digoxin antibody.
Figure 2
Figure 2
Detection of DA within cytogenetically-distinguishable homologous regions of known parental origin. Genomic coordinates of single copy probes detecting DA within 5 different chromosomal regions are indicated. Schematic of the normal and derivative (der) or inverted (inv) chromosome with homologous target are shown. Specific chromosomes are highlighted (white rectangles), ‘mat’ and ‘pat’ refer to the maternal or paternal origin of the altered homolog, respectively. Brighter probe intensity was recurrently observed on the same homolog for a probe for each cell line. RGS7 probe had greater target accessibility on the der chromosome 11 (paternal, GM10958). CACNA1B had greater target accessibility on the inv chromosome 9; (maternal, GM01921). ADORA2B:IVS1 and PMP22:IVS3 hybridizations were brighter on the derivative chromosome 17 (paternal, GM06326) and ACR:Ex1-IVS3 hybridizations were brighter on the normal chromosome 22 (maternal, GM10273).
Figure 3
Figure 3
Differential accessibility is non-random and reproducible between individuals. A. The light gray and black shading represents the brighter hybridization to either the normal or abnormal homolog, respectively (hatched marks indicate the paternal homolog). Bars depicting higher percentages correspond to the more accessible, brighter homolog in a given cell. This was the abnormal paternal homolog for RGS7 (sample ID: GM10958), abnormal maternal for CACNA1B (GM01921), abnormal paternal for ADORA2B:IVS1, and PMP22:IVS3 (GM06326), and normal maternal homolog for ACR (GM10273). B. Non-random DA was confirmed using cells from individuals in which the parental origin of the specific chromosomal rearrangement was unknown. The light gray and black shading represents the brighter hybridization to either the normal or abnormal homolog, respectively. Bars depicting higher percentages correspond to the more accessible, brighter homolog in a given cell. RGS7 probe had greater probe target accessibility on the normal chromosome 1 (sample ID: L12-1980). CACNA1B had greater accessibility on chromosome 9 with heteromorphic variant (L13-72). ADORA2B:IVS1 and PMP22:IVS3 probes were brighter on the abnormal and normal chromosome 17s, respectively (L12-1980) while ACR showed greater accessibility to the normal chromosome 22 (L11-729). C. Quantification of probe signal fluorescence between homologs are shown by box plots of normalized integrated fluorescence intensity ratios. Single copy probes detecting DA (RGS7, CACNA1B, PMP22:IVS3, ADORA2B:IVS1, ACR) exhibited large differences in hybridization intensities between homologs. This is indicated by the broad inter-quartile range of normalized intensity ratios from 0.55-1 (median intensity ratio, 0.87). By contrast, normalized intensity ratios for single copy FISH probes (CCNB1, Corf66, PMP22:IVS4-Ex 5, ADORA2B:Promoter-Ex1 and 1p36.3 intregenic region) with equal accessibility ranged from 0.07-0.31 (median intensity ratio, 0.14). Intensity differences between homologs were quantified by GVF from 125 metaphase cells for each probe category.
Figure 4
Figure 4
Differential accessibility is non-random among related individuals. A. Schematic of a two probe two color single copy FISH strategy to distinguish chromosome 15 homologs is shown. The hemizygous deletion on proximal chromosome 15q is identified by the loss of probe UBE3A (green) on one homolog and the presence of HERC2, GABRA5, SNPRN (red, pink). The deletion occurs on the paternal homolog in individual II-1 (mother) and on the maternal homolog in the children (III-1 and III-2). DA for probes outside of the deletion is represented by a bright hybridization on one homolog (red circle) and weak fluorescence hybridization on the other one (pink circle). The deleted chromosome is gray and the normal chromosome is white. B. DA detected by HERC2, GABRA5, SNPRN showed that the paternal chromosome in the three individuals (deletion in II-1; normal in III-1 and III-2) contained the brighter fluorescence intensities (HERC2 II-1, 73.3% of metaphase cells III-1, 84.6%; GABRA5 II-1, 68% III-2, 77.8%; SNRPN II-1, 82.6% III-2, 75.0%) and was more accessible.
Figure 5
Figure 5
Visualization of metaphase chromosome differential accessibility in 2- and 3-dimensions. A. Epifluorescence image of metaphase cell hybridized with HERC2 single copy probe (1.81 kb) shows a DA pattern. Chromosome 15 homologs are magnified. 3D structured illumination microscopy of hybridized probe volume (panel B) and probe depth (panel C) for the magnified homologs in panel A are presented. B. The left homolog with greater accessibility contains fluorescence embedded within the chromosome and protrudes above the surface. In contrast, the right homolog with less accessibility has a much smaller volume of hybridized probe fluorescence and is mainly embedded within the chromosome. Reconstructed volume view in the left homolog was generated by rotating it clockwise about the z-axis (see orientation schematic). Volume view in the right homolog was generated by up-righting it (arrow 1) and turning it clockwise (arrow 2) (see schematic). C. Crosshairs are centered over the maximal fluorescent intensity projection along the XY, XZ and YZ axes for each chromosome 15 homolog, and highlight differences in chromatin accessibility. The axial projection (depth) of the probe fluorescence spans 18 of 21 0.1 μm reconstructed optical sections (white rectangles delineate boundaries along the z axis) in the left more accessible homolog; and only 12 of 21 reconstructed optical sections in the right homolog (white rectangles).
Figure 6
Figure 6
Visualization of metaphase chromosome equivalent accessibility in 2- and 3-dimensions. A. Epifluorescence image of metaphase cell hybridized with a low copy probe (3.4 kb) within NOMO1. 3D structured illumination microscopy of hybridized probe volume (panel B) and probe depth (panel C) for the homologs in panel A are presented. B. Both homologs show equivalent hybridization accessibility, where the fluorescence is embedded within the chromosome and protrudes above the surface. Reconstructed volume view in the left homolog was generated by up-righting it (arrow 1) and turning it clockwise about the z-axis (arrow 2) (see orientation schematic). Volume view in the right homolog was generated by up-righting it (arrow 1) and turning it counter-clockwise (arrow 2) (see schematic). C. Crosshairs are centered over the maximal fluorescent intensity projection along the XY, XZ and YZ axes for each chromosome 16 homolog. The axial projection (depth) of the probe fluorescence spans 15 of 18 0.1 μm reconstructed optical sections for both homologs, depicting equivalent chromatin accessibility (white rectangles delineate boundaries along the Z axis).
Figure 7
Figure 7
Correspondence of metaphase chromosome accessibility with epigenetic marks associated with open chromatin in interphase. Genome browser tracks show integrated ChIP-seq signal intensities of open chromatin features (y-axis) determined by ENCODE. Genomic locations for a set of representative single copy probe intervals is provided (GRCh37) along x-axis, probe size in kilobase pairs is represented by black bar, and genes are shown in blue. A. Genomic regions with equivalent accessibility show a higher density of open chromatin epigenetic features than regions with DA (panel B). C. The distributions of integrated intensities for each open chromatin feature were plotted around the 95% confidence interval for all probe intervals provided in Table 1, and grouped according to whether the probes showed DA (black bars) or equivalent accessibility (red bars). Group means of the integrated intensity values are shown on the y-axis (y = log 10) and individual features of open chromatin are indicated on the x-axis. The mean integrated ChIP-seq intensities of open chromatin features were significantly different by ANOVA (p =1.0E-04), in particular for all histone marks and DNase I HS, between DA and sequences with equivalent accessibility.

Similar articles

Cited by

References

    1. Londoño-Vallejo JA, DerSarkissian H, Cazes L, Thomas G. Differences in telomere length between homologous chromosomes in humans. Nucleic Acids Res. 2001;29:3164–3171. doi: 10.1093/nar/29.15.3164. - DOI - PMC - PubMed
    1. Ghosh PK, Rani R, Nand R. Lateral asymmetry of constitutive heterochromatin in human chromosomes. Hum Genet. 1979;52:79–84. doi: 10.1007/BF00284600. - DOI - PubMed
    1. Wang Y, Maharana S, Wang MD, Shivashankar GV. Super-resolution microscopy reveals decondensed chromatin structure at transcription sites. Sci Rep. 2014;4:4477. - PMC - PubMed
    1. Ushiki T, Hoshi O. Atomic force microscopy for imaging human metaphase chromosomes. Chromosome Res. 2012;16:383–396. doi: 10.1007/s10577-008-1241-7. - DOI - PubMed
    1. Khan WA, Chisholm R, Tadayyon S, Subasinghe A, Norton P, Samarabandu J, Johnston LJ, Knoll JH, Rogan PK. Relating centromeric topography in fixed human chromosomes to α-satellite DNA and CENP-B distribution. Cytogenet Genome Res. 2013;139:234–242. doi: 10.1159/000348744. - DOI - PubMed

LinkOut - more resources