. 2014 Nov 19;4(6):648-62.
eCollection 2014.

Methylation-associated silencing of MicroRNA-335 contributes tumor cell invasion and migration by interacting with RASA1 in gastric cancer

Affiliations

Methylation-associated silencing of MicroRNA-335 contributes tumor cell invasion and migration by interacting with RASA1 in gastric cancer

Zhengrong Li et al. Am J Cancer Res. .

Abstract

MicroRNAs (miRNAs) are small non-coding RNAs that function as endogenous silencers of target genes, previous studies have shown that miR-335 play an important role in suppressing metastasis and migration in human cancer including gastric cancer (GC). However, the mechanisms which result in aberrant expression of miR-335 in GC are still unknown. Recent studies have shown that the silencing of some miRNAs is associated with DNA hypermethylation. In this study, we find the promoter of miR-335 we embedded in CpG island by accessing to bioinformatics data and the low expression of miR-335 in 5 gastric cell lines can be restored by 5-aza-2'-deoxycytidine (5-Aza-dC) treatment. So we postulated that the miR-335 genes undergo epigenetic inactivation in GC. Subsequently, in GC cells and tissues, we performed quantitative real-time PCR (RTQ-PCR) to assess the expression of miR-335, and methylation-specific PCR (MSP) and bisulfite sequence-PCR (BSP) to evaluate the DNA methylation status in the CpG islands upstream of MiR-335. The result showed that the expression of miR-335 was significantly reduce in gastric cancer cell lines and tumor tissues compared to matched normal gastric tissues, and cell lines, and which is inverse correlation with DNA hypermethylation of miR-335 both in GC cells lines and tissues, but not in normal tissues. In addition, we found that the lower miR-335 expression induced by abnormal methylation may be mainly involved in gastric cell invasion and metastasis in GC tissues. No statistical significance was found about miR-335 expression and methylation level between healthy individuals with and without H. pylori (HP) infection. Finally, we carry out miRNA transfection, RTQ-PCR and western blot assay to find the RAS p21 protein activator (GTPase activating protein) 1 (RASA1) may be the possible target genes which lead to the gastric cell invasion and metastasis, furthermore, the re-expression of endogenous miR-335 by 5-Aza-dC treatment can exert effects similar to exogenous miRNAs transfection. Taken together, our results suggest that miR-335 may be silenced by promoter hypermethylation and play important roles in gastric cell invasion and metastasis through its target genes, such as RASA1. Its methylation level might be a predictive epigenetic marker of GC and remodeling on the expression by demethylation can provided a potential therapeutic strategy.

Keywords: Cancer metastasis; MiR-335; RASA1; cancer invasion; gastric carcinoma; methylation.


Figures
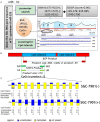
Figure 1
Figure 1
Bioinformatics analysis of MicroRNA-335. (A) A flow chart used for the identification of epigenetically silenced miR-335 genes by bioinformatics database. Firstly, obtaining the 5kb DNA sequence of 5’-upstream, by which we search CpG island and promoter of miR-335, the promoter, determined by comparing, is located on the island. Then, we design one BSP and three MSP primers according to the CpG cites. The black circle and (B) exhibit the specific location, PCR product and the relationship between BSP and MSP1 primer. (C) The BSP histogram result of SGC-7901 cells treated with 5-aza-dC in the region of MSP1 with 11 CpG sites, the figure come from BiQ Analyzer and detailed interpretation is shown in Supplementary Figure 2.
Figure 2
Figure 2
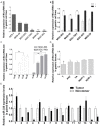
Analysis of miR-335 expression in GC cell lines and tissues. A. RTQ-PCR results for miR-335 in a panel of GC cell lines. Results are presented relative to normal gastric epithelial cell GES-1 (as the control) and normalized to internal U6 snRNA expression. Shown are the means of the values, error bars represent stand deviations; B. RTQ-PCR results for miR-335 in all GC cell lines, with (+) or without (-) 5-aza -CdR treatment; C. RTQ-PCR results for miR-335 in GC cell lines SGC-7901 and MGC-803 with different concentration 5-aza -CdR treatment; D. RTQ-PCR results for miR-335 in paired tumor (T) and non-tumor gastric tissues (PNT), surgical margin tissue (TA) and normal gastric mucosa from healthy individuals with (+) and without (-) H. pylori (HP) infection (as control); E. RTQ-PCR results for miR-335 in random selected 15 human GC paired tumor and non-tumor gastric tissues, the expression levels of tumor were independently calculated relative to those of non-tumor cases, which are normalized to 1. **refers to statistical significance between cell lines (p < 0.01, *p < 0.05).
Figure 3
Figure 3
Analysis of miR-335 methylation status in GC cell lines and it’s correlation with miR-335 expression. A. MSP of two CpG islands (1 and 3) in miR-335 promoter from bisulfite-treated DNA of various lines. PC: positive control (completely methylation) (NC) negative control (completely unmethylation); B. Bisulfite sequencing of the miR-335 CpG island (1 and 2) in GC cells, Open and filled circles represent unmethylated and methylated CpG sites, respectively. Each horizontal row represents a single clone. There are 33 CpG sites in the region. MSP1 between black arrow represent the region of methylation-specific PCR, the result of MSP1 exhibited in Figure 3A (island 1). The BSP histogram of SGC-7901 cell between black arrows is shown in Figure 1C; C. CpG methylation status in cells as a function of miR-335 expression; D. Bisulfite sequencing in GC cell lines SG-7901 and MKN-28, with (+) or without (-) 5-aza -CdR treatment. Open and filled circles represent unmethylated and methylated CpG sites, respectively. The black line between circles represent the base pairs between each CpG sites, each horizontal row represents a single clone. There are 33 CpG sites.
Figure 4
Figure 4
Analysis of miR-335 methylation status in tissues and it’s correlation with miR-335 expression. A. Representative results of the MSP analysis for miR-335 in tissues; B. The expression levels of miR-335 were compared between methylated group and unmethylated group in tumor tissues and non-tumor tissues (N); C. Methylation status in selected 15 paired tumor (T) and non-tumor gastric tissues (N); D. Methylation status in selected (n=10) healthy cases with and without H. pylori (HP) infection; E. Bisulfite sequencing in selected paired tumor (T) and non-tumor gastric tissues (N) (Case 8 and case 14); F. Summarized BSP results of each clone exhibited in Figure 4C.
Figure 5
Figure 5
Schematic representations of predicted miR-335 binding sites in the RASA1 3’-UTR by two representative predicted microRNA targets website micoRNA and TargetScan 6.2. The orange and nattier blue rectangle (63-86 and 76-82) located in 3’-UTR shows the miR-335/RASA1 sequence alignment.
Figure 6
Figure 6
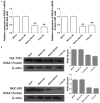
Targets of miR-335. A. RTQ-PCR results of candidate target genes in the indicated GC cell lines transfected with Hsa-miR-335 mimics and negative control (NC mimic) and with 5-aza -CdR treatment. Results are shown relative to a value of 1 assigned to cells without treatment (Mock), after normalization to internal β-actin RNA expression . Shown are the means of three replications, error bars represent stand deviations. **refers to statistical significance between cell lines (p < 0.01, *p < 0.05); B. West blot analysis of the protein levels downregulated by miR-335 and 5-aza -CdR in the indicated GC cell lines SGC-7901 and MGC-803. The histogram represents the gray value ratio of RASA1 and internal β-actin protein levels.

References

    1. Siegel R, Ma J, Zou Z, Jemal A. Cancer statistics, 2014. CA Cancer J Clin. 2014;64:9–29. - PubMed
    1. Orditura M, Galizia G, Sforza V, Gambardella V, Fabozzi A, Laterza MM, Andreozzi F, Ventriglia J, Savastano B, Mabilia A, Lieto E, Ciardiello F, De Vita F. Treatment of gastric cancer. World J Gastroenterol. 2014;20:1635–1649. - PMC - PubMed
    1. Welch DR, Rinker-Schaeffer CW. What defines a useful marker of metastasis in human cancer? J Natl Cancer Inst. 1999;91:1351–1353. - PubMed
    1. Hoon DS, Kitago M, Kim J, Mori T, Piris A, Szyfelbein K, Mihm MC Jr, Nathanson SD, Padera TP, Chambers AF, Vantyghem SA, MacDonald IC, Shivers SC, Alsarraj M, Reintgen DS, Passlick B, Sienel W, Pantel K. Molecular mechanisms of metastasis. Cancer Metastasis Rev. 2006;25:203–220. - PubMed
    1. Aigner A. MicroRNAs (miRNAs) in cancer invasion and metastasis: therapeutic approaches based on metastasis-related miRNAs. J Mol Med (Berl) 2011;89:445–457. - PubMed

LinkOut - more resources