

Network-based biomarkers enhance classical approaches to prognostic gene expression signatures
- PMID: 25521200
- PMCID: PMC4290694
- DOI: 10.1186/1752-0509-8-S4-S5
Network-based biomarkers enhance classical approaches to prognostic gene expression signatures
Abstract
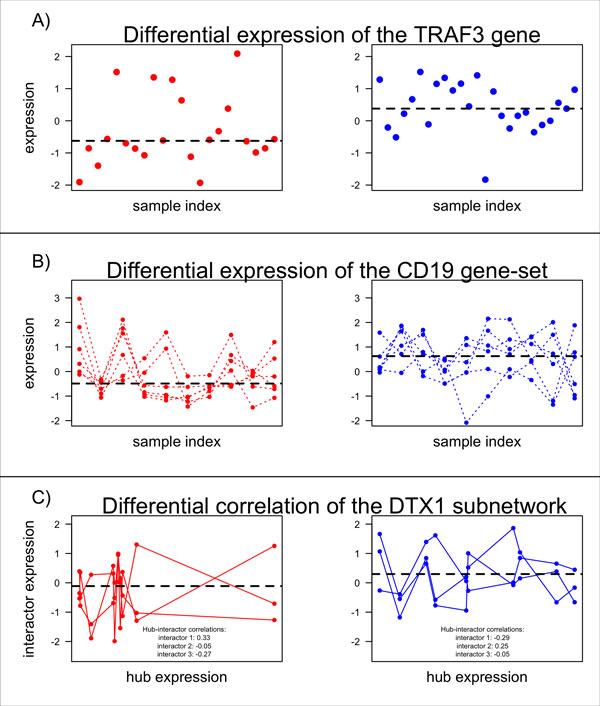
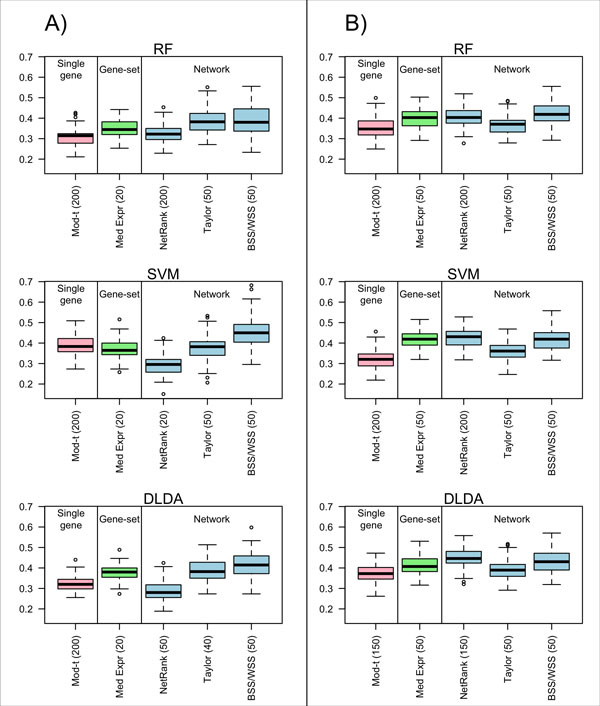
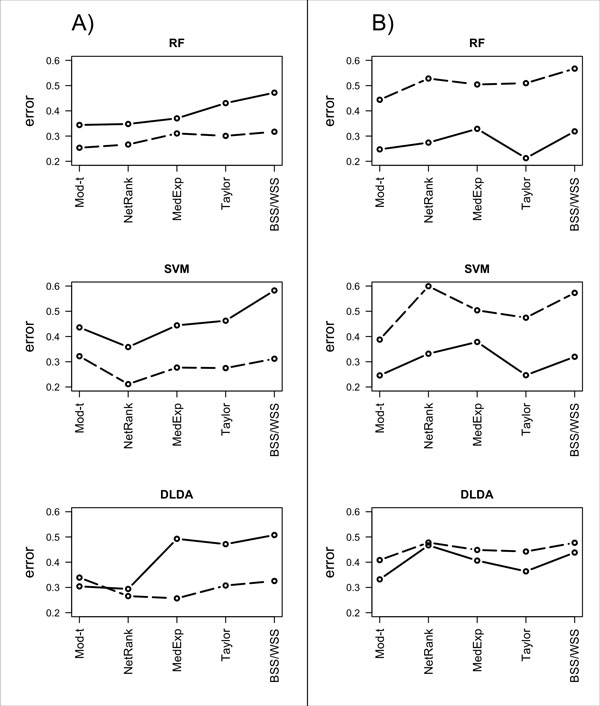
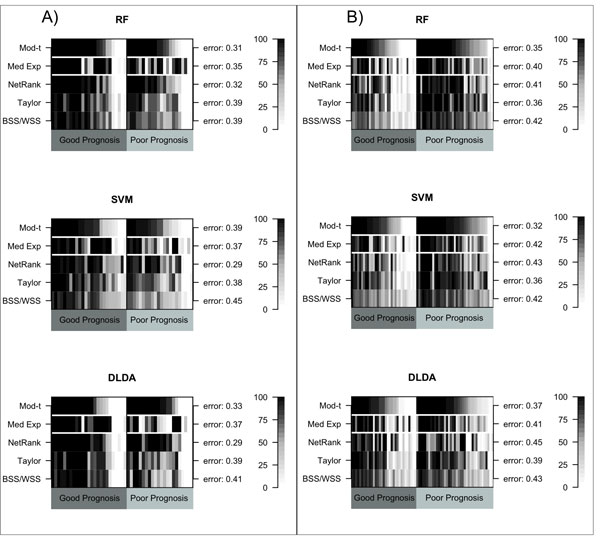
Background: Classical approaches to predicting patient clinical outcome via gene expression information are primarily based on differential expression of unrelated genes (single-gene approaches) or genes related by, for example, biologic pathway or function (gene-sets). Recently, network-based approaches utilising interaction information between genes have emerged. An open problem is whether such approaches add value to the more traditional methods of signature modelling. We explored this question via comparison of the most widely employed single-gene, gene-set, and network-based methods, using gene expression microarray data from two different cancers: melanoma and ovarian. We considered two kinds of network approaches. The first of these identifies informative genes using gene expression and network connectivity information combined, the latter drawn from prior knowledge of protein-protein interactions. The second approach focuses on identification of informative sub-networks (small networks of interacting proteins, again from prior knowledge networks). For all methods we performed 100 rounds of 5-fold cross-validation under 3 different classifiers. For network-based approaches, we considered two different protein-protein interaction networks. We quantified resulting patterns of misclassification and discussed the relative value of each relative to ongoing development of prognostic biomarkers.
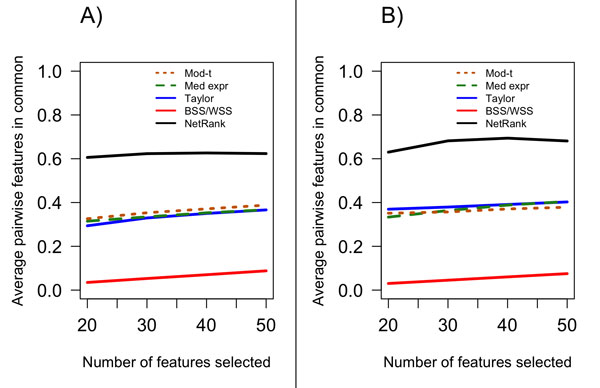
Results: We found that single-gene, gene-set and network methods yielded similar error rates in melanoma and ovarian cancer data. Crucially, however, our novel and detailed patient-level analyses revealed that the different methods were correctly classifying alternate subsets of patients in each cohort. We also found that the network-based NetRank feature selection method was the most stable.
Conclusions: Next-generation methods of gene expression signature modelling harness data from external networks and are foreshadowed as a standard mode of analysis. But what do they add to traditional approaches? Our findings indicate there is value in the way in which different subspaces of the patient sample are captured differently among the various methods, highlighting the possibility of 'combination' classifiers capable of identifying which patients will be more accurately classified by one particular method over another. We have seen this clearly for the first time because of our in-depth analysis at the level of individual patients.
Figures
References
-
- Weigelt B, Baehner FL, Reis JS. The contribution of gene expression profiling to breast cancer classification, prognostication and prediction: a retrospective of the last decade. Journal of Pathology. 2010;220:263–280. - PubMed
-
- Sanz-Pamplona R, Berenguer A, Cordero D, Riccadonna S, Solé X, Crous-Bou M, Guinó E, Sanjuan X, Biondo S, Soriano A. et al.Clinical Value of Prognosis Gene Expression Signatures in Colorectal Cancer: A Systematic Review. PLoS ONE. 2012;7:e48877. doi: 10.1371/journal.pone.0048877. - DOI - PMC - PubMed
Publication types
MeSH terms
Substances
Associated data
- Actions
- Actions
LinkOut - more resources
Full Text Sources
Other Literature Sources
Molecular Biology Databases
