. 2014 Dec 18;10(12):e1004890.
doi: 10.1371/journal.pgen.1004890. eCollection 2014 Dec.

Altered chromatin occupancy of master regulators underlies evolutionary divergence in the transcriptional landscape of erythroid differentiation

Affiliations

Altered chromatin occupancy of master regulators underlies evolutionary divergence in the transcriptional landscape of erythroid differentiation

Jacob C Ulirsch et al. PLoS Genet. .

Abstract

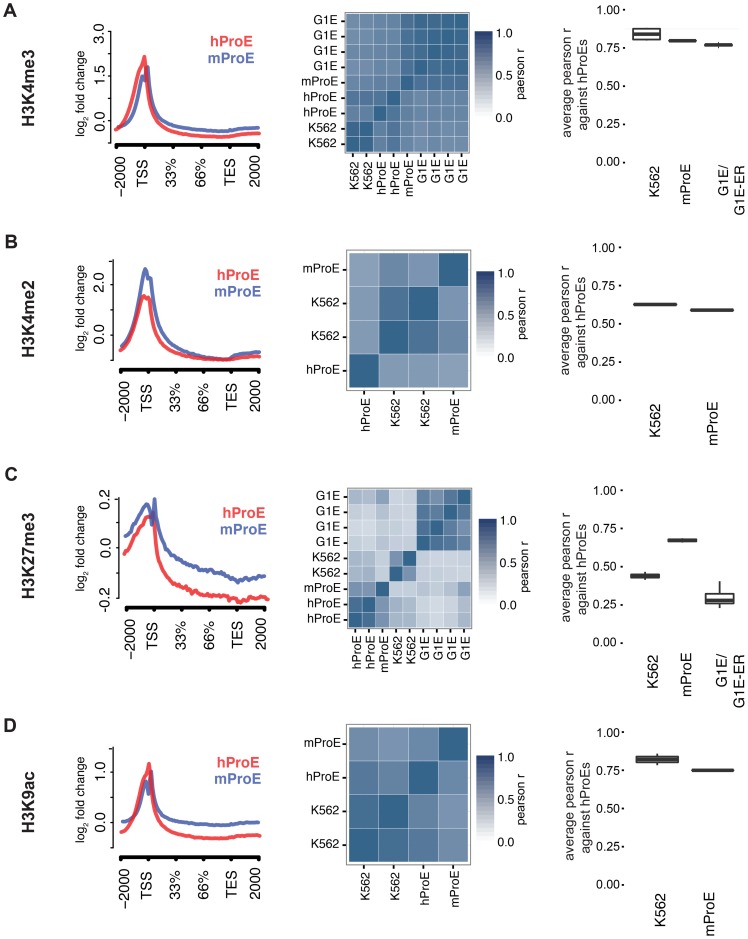
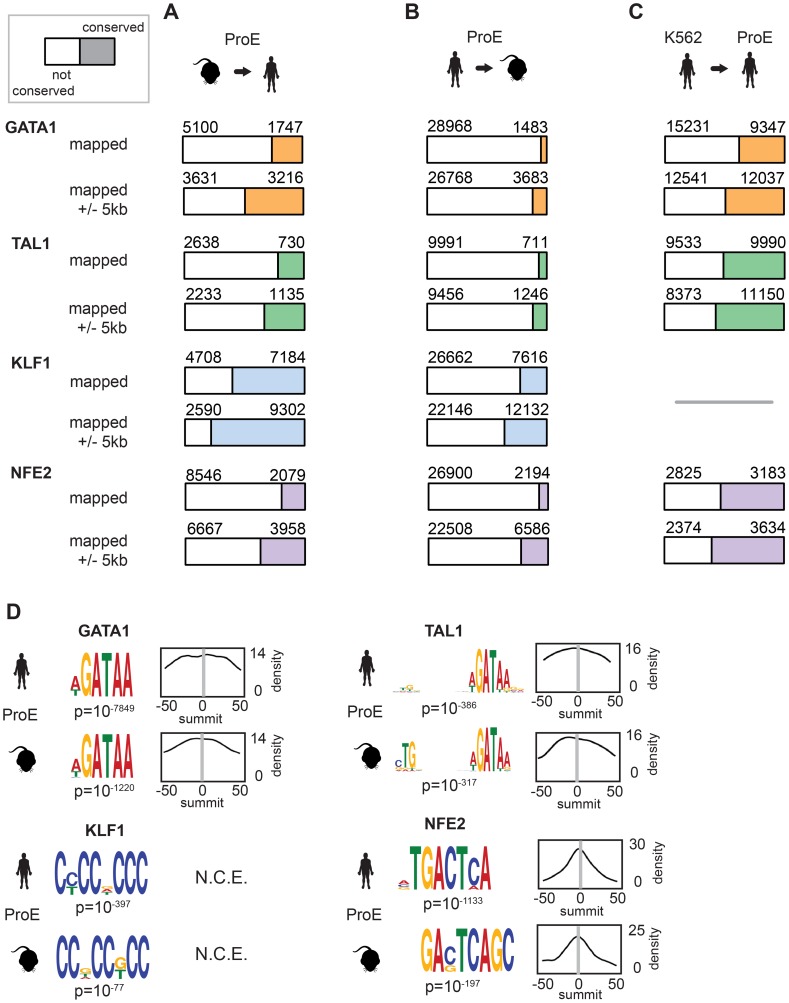
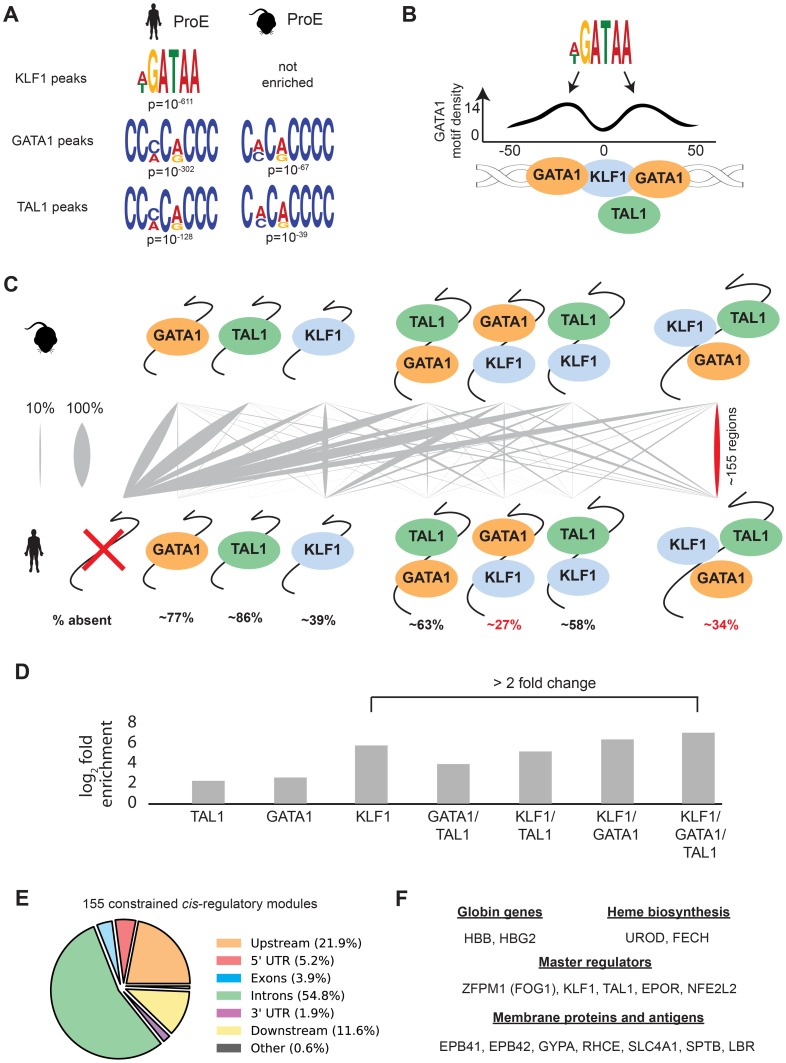
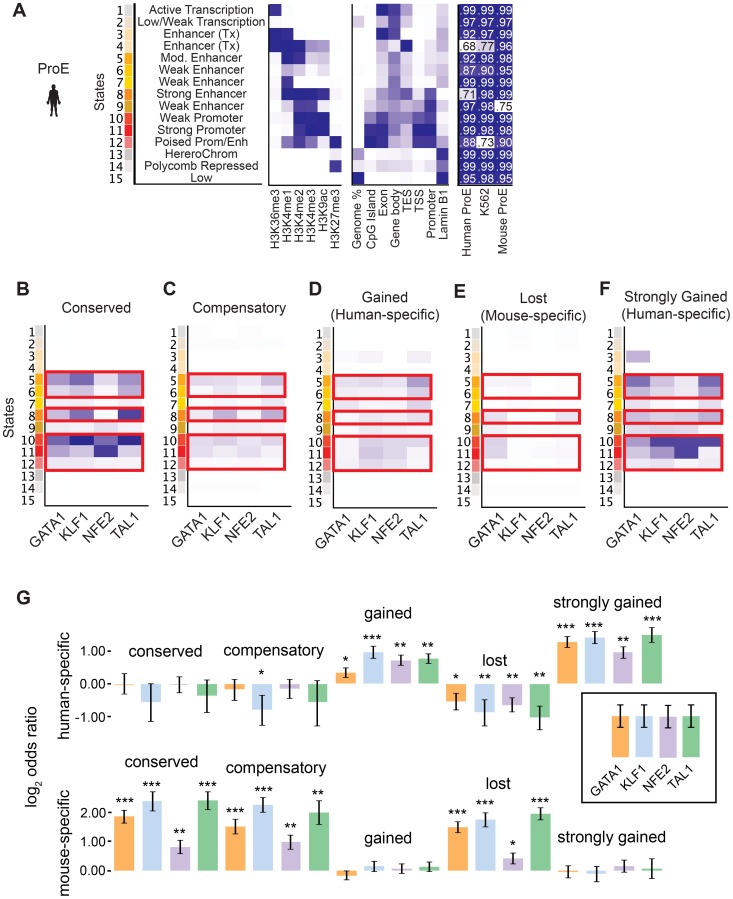
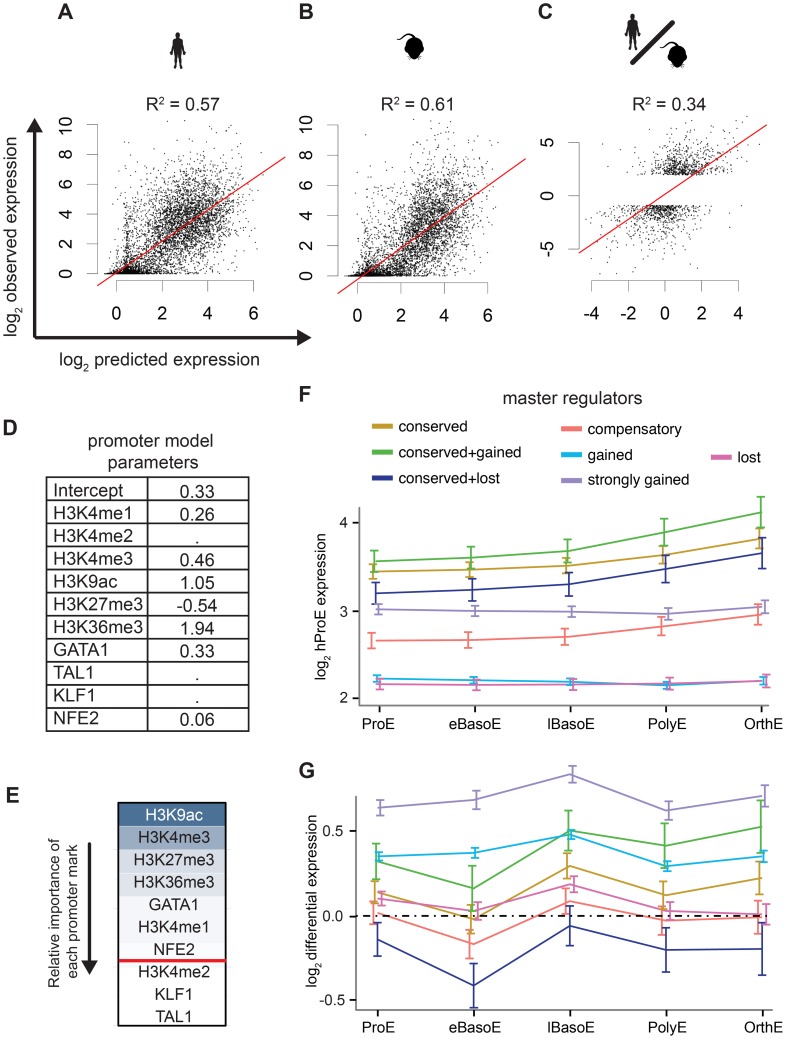
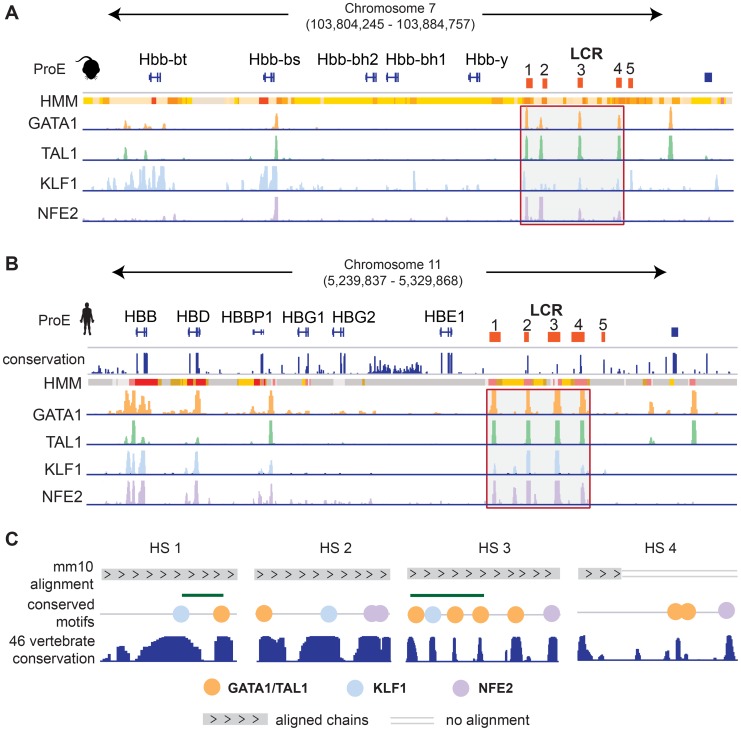
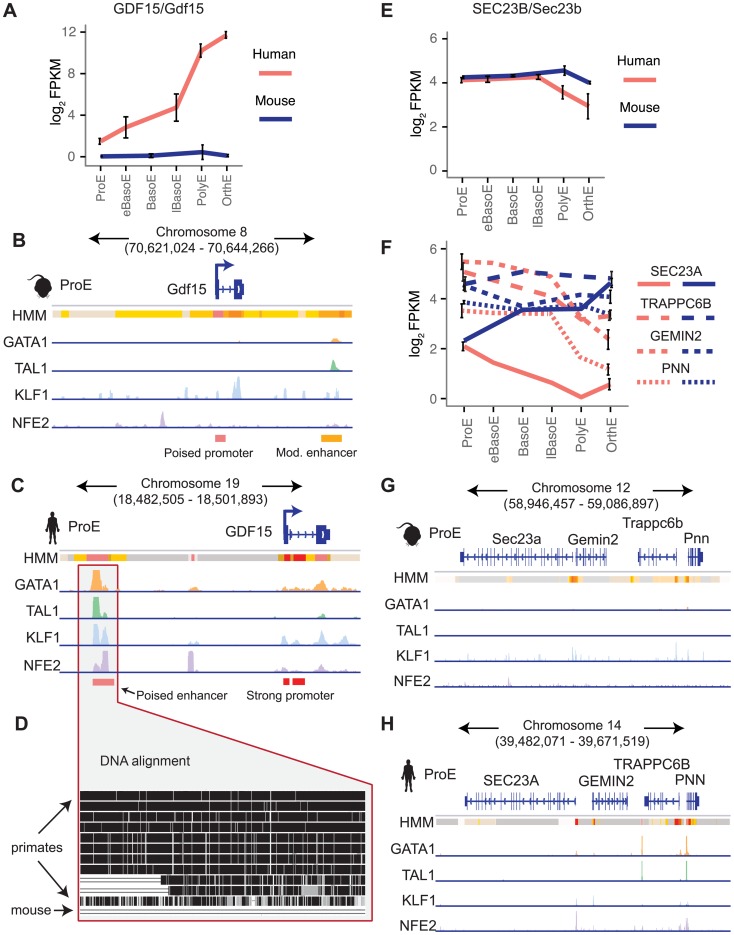
Erythropoiesis is one of the best understood examples of cellular differentiation. Morphologically, erythroid differentiation proceeds in a nearly identical fashion between humans and mice, but recent evidence has shown that networks of gene expression governing this process are divergent between species. We undertook a systematic comparative analysis of six histone modifications and four transcriptional master regulators in primary proerythroblasts and erythroid cell lines to better understand the underlying basis of these transcriptional differences. Our analyses suggest that while chromatin structure across orthologous promoters is strongly conserved, subtle differences are associated with transcriptional divergence between species. Many transcription factor (TF) occupancy sites were poorly conserved across species (∼25% for GATA1, TAL1, and NFE2) but were more conserved between proerythroblasts and cell lines derived from the same species. We found that certain cis-regulatory modules co-occupied by GATA1, TAL1, and KLF1 are under strict evolutionary constraint and localize to genes necessary for erythroid cell identity. More generally, we show that conserved TF occupancy sites are indicative of active regulatory regions and strong gene expression that is sustained during maturation. Our results suggest that evolutionary turnover of TF binding sites associates with changes in the underlying chromatin structure, driving transcriptional divergence. We provide examples of how this framework can be applied to understand epigenomic variation in specific regulatory regions, such as the β-globin gene locus. Our findings have important implications for understanding epigenomic changes that mediate variation in cellular differentiation across species, while also providing a valuable resource for studies of hematopoiesis.


Conflict of interest statement

The authors have declared that no competing interests exist.

Figures

Figure 1
Figure 1. Inter- and intra-species conservation of histone modifications in orthologous promoters.
A)–D) Left: Average curves of normalized log2 fold changes across 15506 orthologous genes for each histone mark. The size of each gene is normalized in order to represent the average shape of histone mark intensity. Middle: Heatmaps are clustered by the similarity of the pearson r for histone mark intensities between all cell-types. hProEs are CD71+, mProEs are Ter119+, K562 cells are a human erythroid cell line, and G1E/G1E-ER cells are a mouse erythroid cell line. Replicates are included as independent observations. Right: For each category shown (e.g. mProEs, K562, and G1E/G1E-ER), the average pearson correlation between each replicate of that type and each replicate of human ProEs is presented as boxplots. Abbreviations used: hProE, human pro-erythroblast; mProE, mouse pro-erythroblast.
Figure 2
Figure 2. Divergence of transcription factor occupancy sites between human and mouse.
A) For each TF (GATA1, TAL1, KLF1, and NFE2), a narrow occupancy site (summit +/- 50 bp) was mapped from mouse ProEs (mm10) to hg19 coordinates using the UCSC liftOver tool and intersected with corresponding peaks in human ProEs. To investigate “compensatory” new occupancy sites in hg19, narrow peaks that were mapped were expanded 5000 bps in each direction and the overlap was recomputed. The denominator (blue, orange, green, or purple plus white) represented the total number of mapped peaks from mouse ProEs to hg19, and the numerator (blue, orange, green, or purple) represented the total number of these mapped peaks that overlap with peaks in human ProEs, referred to as “conserved” occupancy in the main text. B) Similar to A), except that peaks in human ProEs (hg19) were mapped to peaks in mouse ProEs (mm10). Please note that the total number of peaks mapped from mouse to human is smaller than the number mapped from human to mouse. C) Similar to B), except that peaks in the K562 erythroid cell line were directly intersected with peaks in human ProEs. KLF1 data was not available for K562 cells so no overlap was computed. D) For each peak in human and mouse ProEs, MeME-Chip was used to recover canonical motifs for each TF (GATA1, TAL1, KLF1, and NFE2) in a small window (+/- 50 bps) around the summit of each peak. The probability density for each motif is shown across the region (for example, a density of 14 is a probability of 0.14 on a 0 to 1 scale). Abbreviations used: ProEs, pro-erythroblasts; N.C.E, no central enrichment.
Figure 3
Figure 3. Combinatorial occupancy patterns of transcription factors are strongly conserved.
A) In human ProE KLF1 peaks (summit +/- 50 bp), GATA1 motifs were significantly enriched. In human and mouse ProE GATA1 and TAL1 peaks, certain KLF1 motifs were significantly enriched. B) Enrichment of GATA1 motifs identified in A) at non-random distances from the summit of KLF1 occupancy sites reveals that GATA1 and GATA1/TAL1 occupancy may often be found in KLF1-occupied regions. Scales are identical to Fig. 2D. C) For each combinatorial group, the proportion (xi/n) that is mapped from mouse to human is represented as grey lines, where a thicker grey line indicates that a larger proportion. Most regions in mouse are lost in human, but certain combinations (GATA1 and KLF1; GATA1, KLF1, and TAL1) are significantly more conserved than others (p<10−16). % absent is (1- number of mapped regions with no TF occupancy). D) Fold enrichment of combinatorial TF occupancy overlap (observed divided by expected) between species calculated with GAT. E) Genomic localization of the 155 conserved GATA1, KLF1, and TAL1 co-occupied regions. F) A large number of canonical erythroid genes are assigned by proximity to these 155 regions, suggesting that these are co-occupied regions are functionally conserved regulators. Abbreviations used: ProEs, pro-erythroblasts; GAT, Genomic Association Tester.
Figure 4
Figure 4. Species-specific and conserved transcription factor occupancy associates with histone modifications.
A) Emission states of chromatin structure from ChromHMM. Darker blues correspond to higher percentage of representation in a specific state. In addition to chromatin modifications, states are compared to known genomic regions where darker blues correspond to increased fold enrichment versus expected. Each state was highly correlated (pearson correlation values shown) with at least one state in models learned separately in human ProEs, mouse ProEs, and K562 cells. B)–F) Chromatin state enriched in B) TF occupancy sites conserved between human and mouse, C) compensatory TF occupancy sites that are human-specific and proximal (+/- 5kb) to a lost TF occupancy site during evolution, D) human-specific occupancy sites that are gained during evolution, E) mouse-specific occupancy sites that are lost during evolution, and F) top 10% of human occupancy sites based upon mapped reads. Probability of enrichment is scaled across all peak regions. Overall, promoter and enhancer regulatory regions are decreasingly enriched for conserved, compensatory and human-specific, and finally mouse-specific occupancy sites. G) Human-specific genes are defined as the top 10% of differentially expressed genes in human ProEs and mouse-specific genes are defined as the top 10% of differentially expressed genes in mouse ProEs. For each category of TF occupancy, log2 odds ratios for the frequency of TF occupancy in human- or mouse-specific genes are compared to this frequency in the remaining 90% of genes. Abbreviations used: ProEs, pro-erythroblasts.
Figure 5
Figure 5. Predictive models of gene expression across species.
A)–C) The y-axis is observed values and the x-axis is predicted values. R2 values are reported from each consensus model where the lambda “penalty” value is cross-validated ten times and chosen as 1 standard error below the best to prevent over fitting. A) Consensus model predictions from mouse ProE epigenomic marks predict mouse ProE gene expression. B) Consensus model predictions from human ProE epigenomic marks predict human ProE gene expression. C) Applying the consensus model to the difference of human and mouse epigenomic marks is predictive of differences in transcription between the species. D) Coefficients for each retained variable for consensus model (top of A)). E) Relative importance of each epigenomic mark in the consensus model based upon scaled coefficients in the consensus model (un-scaled coefficients are shown in D). F) Gene expression patterns during terminal erythroid differentiation based upon proximity to TF occupancy sites for varying TF occupancy conservation (defined in Fig. 4B–F) across all TFs. G) Similar to F), except shown for changes in gene expression between the two species (human-specific genes correspond to positive values). Abbreviations used: ProEs, pro-erythroblasts; eBasoE, early basophilic erythroblasts; BasoE, basophilic erythroblasts; lBasoE, late basophilic erythroblasts; PolyE, polychromatic erythroblasts; OrthE, orthochromatic erythroblasts; FPKM, fragments of aligned reads per kilobase of transcript per million mapped reads.
Figure 6
Figure 6. Conservation of the epigenome at the locus control region.
A)-B) For both A) mouse and B) human ProEs, chromatin states derived from ChromHMM and TF occupancy profiles for GATA1, TAL1, KLF1, and NFE2 are shown at the globin genes and the locus control region (LCR). The LCR is comprised of 5 HSs. The 1st–4th HSs are highlighted for both mouse and human. Chromatin state legend is provided in Fig. 7B. C) Zoomed in views of the 1st–4th HSs are shown. Chains of the mouse alignment from Multiz 46-verterbrate alignment are shown as well as PhastCons scores of nucleotide conservation across the 46-vertebrate alignment. HS 1 and HS 3 are both occupied by GATA1, TAL1, and KLF1 strongly conserved elements and canonical occupancy sites present in both the mouse and human genomes under strong selective pressure based upon the 46-vertebrate genome conservation. Only part of the genome underlying the GATA1/TAL1 occupancy site in HS 4 can be mapped in mouse including two canonical GATA1/TAL1 motifs that have been identified as under strong selective pressure in other vertebrates. Abbreviations used: ProEs, pro-erythroblasts; LCR, locus control region; HS, hypersensitive site.
Figure 7
Figure 7. Species-specific expression of GDF15 is driven by a human-specific element and the region around SEC23A in humans, but not mouse, is repressed.
A) Gene expression of GDF15 in human ProEs and Gdf15 in mouse ProEs during terminal erythroid differentiation. Error bars represent the mean +/- the standard deviation. Mouse Gdf15 is expressed at very low levels, while human GDF15 is expressed at increasingly high levels during differentiation. B) Human GDF15 in ProEs has a strong promoter and is proximal to a poised enhancer (based on HMM) which is co-occupied by high levels of GATA1, TAL1, KLF1, and NFE2. C) In juxtaposition to human GDF15, mouse Gdf15 has a poised promoter and is proximal to a moderately active promoter that contains GATA1 and TAL1 occupancy, but not KLF1 or NFE2. D) Multiple alignment of 46 vertebrates shows that the underlying genomic sequence of the poised enhancer element near GDF15 is conserved across most primates but absent from the mouse genome. E) SEC23B/Sec23b are similarly expressed in both species. F) The SEC23B/Sec23b paralog, SEC23A/Sec23a, is differentially expressed across species. Three nearby homologous genes (TRAPPC6B, GEMIN2, PNN) show similar species-specific gene expression patterns. G) The genomic region surrounding human SEC23A is generally in a state of heterochromatin or polycomb repression. H) Relative to the orthologous human region, the region surrounding Sec23a is permissive of transcription. Abbreviations used: ProE, pro-erythroblast; FPKM, fragments per kilobase per million.

References

    1. Orkin SH, Zon LI (2008) Hematopoiesis: an evolving paradigm for stem cell biology. Cell 132: 631–644. - PMC - PubMed
    1. Doulatov S, Notta F, Laurenti E, Dick JE (2012) Hematopoiesis: a human perspective. Cell Stem Cell 10: 120–136. - PubMed
    1. Dzierzak E, Philipsen S (2013) Erythropoiesis: development and differentiation. Cold Spring Harb Perspect Med 3: a011601. - PMC - PubMed
    1. Sankaran VG, Ludwig LS, Sicinska E, Xu J, Bauer DE, et al. (2012) Cyclin D3 coordinates the cell cycle during differentiation to regulate erythrocyte size and number. Genes & Development 26: 2075–2087. - PMC - PubMed
    1. Merryweather-Clarke AT, Atzberger A, Soneji S, Gray N, Clark K, et al. (2011) Global gene expression analysis of human erythroid progenitors. Blood 117: e96–108. - PubMed

Publication types