Review
. 2014 Dec 17;84(6):1126-42.
doi: 10.1016/j.neuron.2014.11.022.

Mitochondrial DNA: impacting central and peripheral nervous systems

Affiliations
Review

Mitochondrial DNA: impacting central and peripheral nervous systems

Valerio Carelli et al. Neuron. .

Abstract

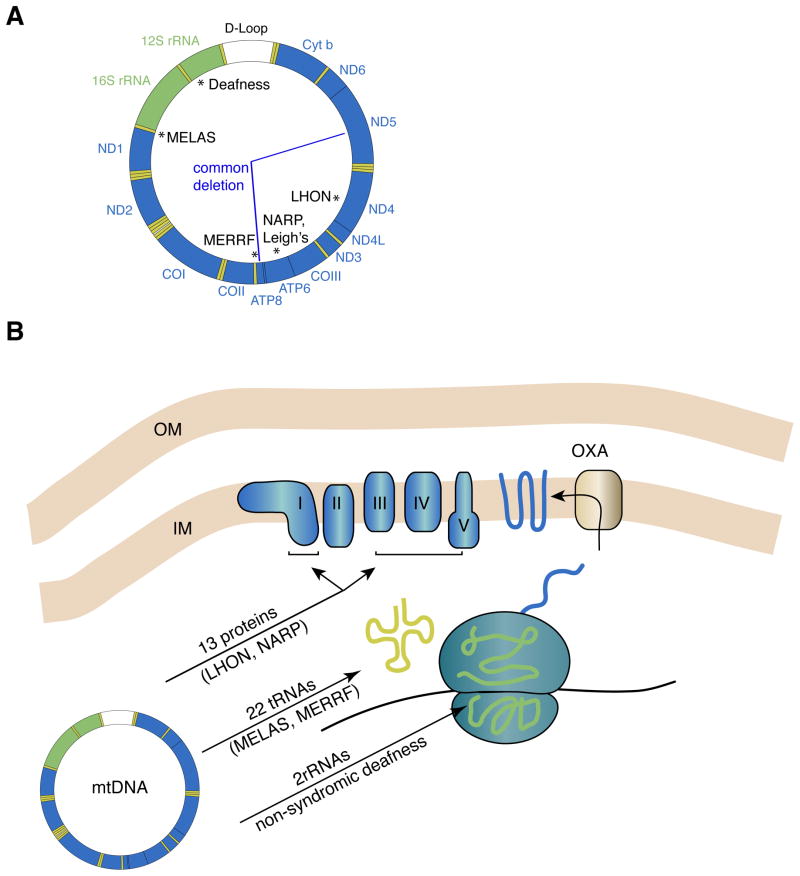
Because of their high-energy metabolism, neurons are strictly dependent on mitochondria, which generate cellular ATP through oxidative phosphorylation. The mitochondrial genome encodes for critical components of the oxidative phosphorylation pathway machinery, and therefore, mutations in mitochondrial DNA (mtDNA) cause energy production defects that frequently have severe neurological manifestations. Here, we review the principles of mitochondrial genetics and focus on prototypical mitochondrial diseases to illustrate how primary defects in mtDNA or secondary defects in mtDNA due to nuclear genome mutations can cause prominent neurological and multisystem features. In addition, we discuss the pathophysiological mechanisms underlying mitochondrial diseases, the cellular mechanisms that protect mitochondrial integrity, and the prospects for therapy.


Figures

Figure 1
Figure 1. The human mtDNA genome and oxidative phosphorylation
(A) Schematic of the circular mtDNA genome, showing the 13 protein coding genes (blue), the 2 rRNAs (green) and the 22 tRNAs (yellow). At the top is the non-coding D-loop (white), also known as the control region. This region is involved in mtDNA replication and transcriptional initiation. Classic examples of point mutations associated with prototypical mitochondrial encephalomyopathies are noted with asterisks. The “common deletion” removes 4977 bp of mtDNA and is one of many deletions that have been associated with sporadic KSS, PEO, and PS. (B) Oxidative phosphorylation and mtDNA gene products. The five enzyme complexes constituting the OXPHOS machinery reside in the mitochondrial inner membrane and consist of components encoded by both the nuclear and mitochondrial genomes. The 13 mtDNA proteins are transmembrane subunits of the enzyme complexes I, III, IV, and V. They are translated in the matrix of the mitochondrion and inserted into the inner membrane via the oxidase assembly (OXA) machinery. Mitochondrial ribosomes have polypeptides encoded by the nuclear genome. These polypeptides assemble into large and small ribosomal subunits that form complexes with rRNAs encoded by the mtDNA. The assembled ribosomes use mtDNA-encoded tRNAs to decode the messenger RNA. Examples of diseases caused by mutations in mtDNA-encoded proteins, tRNAs, and rRNAs are indicated.
Figure 2
Figure 2. Muscle fiber defects and mtDNA deletions associated with a Polg mutation
COX and COX/SDH stains are used to clinically evaluate mitochondrial dysfunction in muscle. (A) COX staining of a transverse muscle section reveals a mosaic pattern, with some fibers showing full enzymatic reaction (+), partial reaction (+/−) and no reaction (−). (B) The double COX/SDH staining of an adjacent section shows that the COX-positive fibers (+) display a brownish color, slightly darker compared to COX alone. In contrast, the COX-negative fibers (−) are intensely stained by SDH (blue) with frequent subsarcolemmal enhancement, and the COX-partial fibers (+/−) are intermediate, with preponderant SDH blue color. (C) Long-range PCR reveals a single band for wild-type mtDNA in the control subject, and multiple smaller bands denoting multiple mtDNA deletions in the patient. Both the histological sections and the mtDNA analysis are from a patient with compound heterozygous Polg mutations and SANDO phenotype. Images are courtesy of Dr. Maria Lucia Valentino.
Figure 3
Figure 3. Nuclearly encoded proteins involved in Mendelian disorders of mtDNA maintenance
(A) Molecules involved in mitochondrial fusion. Mitochondria are dynamic organelles that continually undergo fusion and fission. The balance of these opposing actions controls mitochondrial morphology and enables mixing of the mitochondrial population. Because mitochondria have 2 membranes, mitochondrial fusion is a multi-step process. Outer membrane (OM) fusion requires the mitofusins 1 and 2 (green), transmembrane GTP hydrolyzing enzymes. After outer membrane fusion, inner membrane (IM) fusion requires OPA1 (brown ovals), another large GTPase that is localized to the inner membrane. Mitofusins and OPA1 belong to the dynamin superfamily of GTPases. Mutations in OPA1 and Mfn2 can lead to mtDNA deletions. (B) Nuclearly encoded genes important for mtDNA replication and maintenance. The mitochondrial genome (represented by the closed loop) is replicated by the Polg DNA polymerase, a heterotrimeric enzyme complex composed of the catalytic subunit (POLG1) and 2 accessory subunits (POLG2). Twinkle (C10orf2/PEO1) is a mitochondrial DNA helicase that is thought to unwind mtDNA during at the replication fork (Milenkovic et al., 2013; Tyynismaa et al., 2004). Mgme1 (mitochondrial genome maintenance exonuclease 1) cleaves single-stranded DNA and is essential for mtDNA maintenance. The adenine nucleotide translocase (ANT) in the inner membrane (IM) exchanges ATP for ADP. Several additional proteins, listed at the bottom, are important for regulating dNTP pools or levels in the mitochondria and are important for mtDNA maintenance (see Table I). TK2, DGUOK, SUCLA1, SUCLG1 are mitochondrial proteins; RRM2B is nuclear and TP is cytosolic.
Figure 4
Figure 4. Neurological features in LHON
Fundus images of the right eye (OD) and left eye (OS) of an LHON patient are shown in (A) and (B), respectively. In (A), temporal pallor (pale yellow region, asterisk) of the optic disc (bright circle near the center) indicates initial atrophy of the nerve. This defect is accompanied by the complete loss of fibers of the papillomacular bundle (loss of the translucent stripes in the dark area delimited by the arrows). The remaining quadrants--superior (SUP), inferior (INF) and nasal (NAS)--are characterized by pseudoedema of the retinal fibers, visible as translucent stripes converging to the optic disc, blurring its margins. In (B), the eye is at a preclinical stage, characterized by the still intact papillomacular bundle (presence of the translucent stripes in the area delimited by the arrows) and pseudoedematous appearance of the retinal fibers in all quadrants. The optic disc is hyperemic (congested due to engorgement with blood, asterisk), and retinal vessels are tortuous and frequently blurred by the pseudoedematous nerve fibers. Images courtesy of Dr. Piero Barboni. In (C), (D) and (E), optical coherence tomography (OCT) is used to measure the thickness of the retinal nerve fiber layer (RNFL) for OD (C) and OS (E) of the same patient. In (D), the green area denotes the normal range of retinal fiber layer thickness, whereas the red region indicates a pathological reduction of thickness (atrophy). The OD scan is indicated by the continuous line, which presents a pathological reduction only in the temporal sector (red sector on the circular graph). This is visualized by the pink area of atrophy in (C). OS is indicated by the dotted line and displays an overall increased thickness, being over the green range in all sectors, which denotes preclinical swelling of the retinal fibers due to pseudoedema. This is reflected in a still normal pattern in (E). Images courtesy of Dr. Piero Barboni. (F) and (G) Computerized Humphrey visual fields for OD and OS, respectively. In (F), a central scotoma (dark region) is evident. This defect correlates with the loss of retinal fibers of the papillomacular bundle at fundus observation (A) and detected by OCT measurements (C and D). In (G) the visual field is still unaffected. This is consistent with the preclinical stage of this eye, which has intact papillomacular bundle fibers visible at fundus observation (B) and detected by OCT measurements (D and E). Images courtesy of Dr. Piero Barboni. (H) and (I) Light microscopy appearance of optic nerve cross-sections from control (H) and LHON (I) individuals. In (H), the normal optic nerve is densely packed, with about 1.2 million axons organized in bundles. In (I), there is complete loss of axons (asterisk) in the temporal quadrant (TEMP) corresponding to the papillomacular bundle, and profound depletion of fibers also in the superior (SUP), inferior (INF) and nasal (NAS) sectors with a clear transition zone indicated by the arrows. Images courtesy of Dr. Alfredo A. Sadun and Fred Ross-Cisneros. (J) and (K) Electron microscopy of optic nerve cross-sections from control (J) and LHON (K) individuals. In (J), there is a normal density of axons, with prevalent small caliber ones. In (K), there is profound depletion of axons, in particular the smaller caliber population. The spared axons frequently show a thinner ring of myelin. Images courtesy of Dr. Alfredo A. Sadun and Fred Ross-Cisneros.
Figure 5
Figure 5. Brain magnetic resonance images (MRI) of mitochondrial encephalomyopathies
Two axial brain T1-weighted images from the same patient with Leigh’s syndrome due to complex I deficiency are shown in (A) and (B). In (A), bilateral necrotizing striatal lesions (arrows) and widespread leukoencephalopathy are visible. In (B), the leukoencephalopathy presents with cavitations in the frontal white matter (arrows). Brain images from two MELAS patients are shown in (C) and (D). Axial T2-weighted image (C) shows a large hyperintense area extending in the occipital and parietal lobes of the left hemisphere (right side of image, arrow), the classical posterior location for stroke-like lesions in a patient with the most frequent MELAS m.3243A>G/tRNALeu(UUR) mutation. In another MELAS patient (D), with a complex I mtDNA mutation, multiple and bilaterally distributed cortical signal changes with cavitations (arrows) are evident on a coronal FLAIR (Fluid attenuated inversion recovery) image. These MELAS lesions do not obey the distribution of a major arterial vascular territory. In fact they are not due to a true ischemic infarct of cerebral tissue but to tissue edema and may be transient and partially reversible.

References

    1. Abou-Sleiman PM, Muqit MM, Wood NW. Expanding insights of mitochondrial dysfunction in Parkinson’s disease. Nature reviews Neuroscience. 2006;7:207–219. - PubMed
    1. Achilli A, Iommarini L, Olivieri A, Pala M, Hooshiar Kashani B, Reynier P, La Morgia C, Valentino ML, Liguori R, Pizza F, Barboni P, Sadun F, De Negri AM, Zeviani M, Dollfus H, Moulignier A, Ducos G, Orssaud C, Bonneau D, Procaccio V, Leo-Kottler B, Fauser S, Wissinger B, Amati-Bonneau P, Torroni A, Carelli V. Rare primary mitochondrial DNA mutations and probable synergistic variants in Leber’s hereditary optic neuropathy. PLoS One. 2012:7. - PMC - PubMed
    1. Ahlqvist KJ, Hamalainen RH, Yatsuga S, Uutela M, Terzioglu M, Gotz A, Forsstrom S, Salven P, Angers-Loustau A, Kopra OH, Tyynismaa H, Larsson NG, Wartiovaara K, Prolla T, Trifunovic A, Suomalainen A. Somatic progenitor cell vulnerability to mitochondrial DNA mutagenesis underlies progeroid phenotypes in Polg mutator mice. Cell metabolism. 2012;15:100–109. - PubMed
    1. Al Rawi S, Louvet-Vallee S, Djeddi A, Sachse M, Culetto E, Hajjar C, Boyd L, Legouis R, Galy V. Postfertilization autophagy of sperm organelles prevents paternal mitochondrial DNA transmission. Science. 2011;334:1144–1147. - PubMed
    1. Amati-Bonneau P, Valentino ML, Reynier P, Gallardo ME, Bornstein B, Boissiere A, Campos Y, Rivera H, de la Aleja JG, Carroccia R, Iommarini L, Labauge P, Figarella-Branger D, Marcorelles P, Furby A, Beauvais K, Letournel F, Liguori R, La Morgia C, Montagna P, Liguori M, Zanna C, Rugolo M, Cossarizza A, Wissinger B, Verny C, Schwarzenbacher R, Martin MA, Arenas J, Ayuso C, Garesse R, Lenaers G, Bonneau D, Carelli V. OPA1 mutations induce mitochondrial DNA instability and optic atrophy ‘plus’ phenotypes. Brain. 2008;131:338–351. - PubMed

Publication types

MeSH terms

Substances