Review
. 2014 Dec 17;84(6):1143-56.
doi: 10.1016/j.neuron.2014.10.049.

The orbitofrontal oracle: cortical mechanisms for the prediction and evaluation of specific behavioral outcomes

Affiliations
Review

The orbitofrontal oracle: cortical mechanisms for the prediction and evaluation of specific behavioral outcomes

Peter H Rudebeck et al. Neuron. .

Abstract

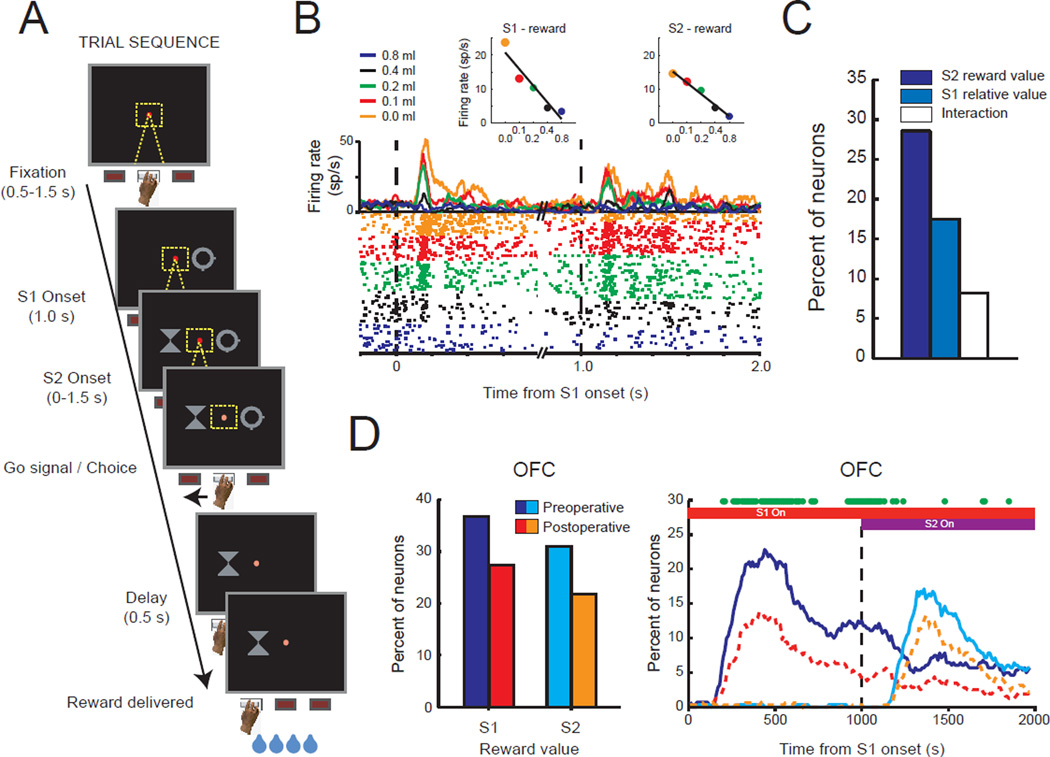
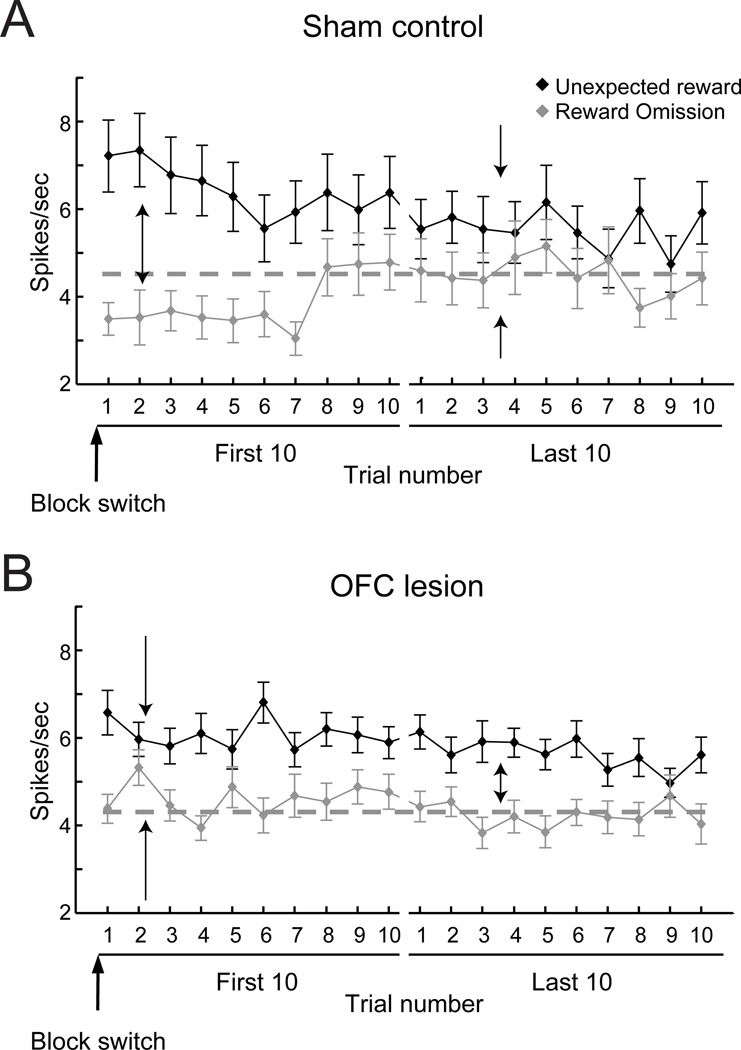
The orbitofrontal cortex (OFC) has long been associated with the flexible control of behavior and concepts such as behavioral inhibition, self-control, and emotional regulation. These ideas emphasize the suppression of behaviors and emotions, but OFC's affirmative functions have remained enigmatic. Here we review recent work that has advanced our understanding of this prefrontal area and how its functions are shaped through interaction with subcortical structures such as the amygdala. Recent findings have overturned theories emphasizing behavioral inhibition as OFC's fundamental function. Instead, new findings indicate that OFC provides predictions about specific outcomes associated with stimuli, choices, and actions, especially their moment-to-moment value based on current internal states. OFC function thereby encompasses a broad representation or model of an individual's sensory milieu and potential actions, along with their relationship to likely behavioral outcomes.


Conflict of interest statement

CONFLICT OF INTEREST: None

Figures

Figure 1
Figure 1
Carmichael and Price’s (1994) parcellation of the ventral surface of the frontal lobe of a macaque brain based on variation in chemo- and cytoarchitecture. Red and purple shaded regions correspond to the lateral and medial subdivisions of OFC, respectively. These two subdivisions are often used in neuropsychological and neurophysiological investigations in primates to grossly subdivide OFC. The medial and lateral orbital sulci are marked by thick black lines. Thick dark arrows indicate connections, based on Carmichael and Price (1995a,b).
Figure 2
Figure 2
The effect of excitotoxic lesions of OFC on reward-guided behavior. A) Excitotoxic OFC lesions; location and extent of the intended lesion shown on drawing of a coronal section through the frontal lobe (Intended lesion, top), representative case with an excitotoxic lesion of OFC (T2-weighted MRI, taken 5 days after the injection of excitotoxins, middle), and representative case with an excitotoxic lesion of OFC (T1-weighted MRI, taken ~3 years after surgery, bottom). B) Serial object reversal learning. Mean (±SEM) number of errors for unoperated controls (CONEXC and CONASP, unfilled circles and squares respectively), macaques with excitotoxic OFC lesions (OFCEXC, shaded triangles) and macaques with aspiration lesions of OFC (OFCASP, shaded diamonds). Unlike monkeys with aspiration lesions of OFC, monkeys with excitotoxic lesions of OFC do not differ from controls in their performance on this task. C) Emotional responses to neutral and fear inducing objects. Mean (±SEM) latency of unoperated controls (unfilled bars) and monkeys with excitotoxic OFC lesions (gray bar) to retrieve a desired food reward in the presence of different objects. Monkeys with excitotoxic lesions of OFC do not differ from controls. D) Devaluation task. Mean (±SEM) difference scores for unoperated controls (unfilled bars) and macaques with excitotoxic lesions of OFC (gray bars) in the object-(left) and action-based (right) devaluation tasks. Same labels as in (C). Monkeys with excitotoxic lesions of OFC are still undergoing behavioral testing; the estimated extents of the OFC lesions as determined from postoperative T2-weighted MR scans ranged from 64 to 96% complete, and later T1-weighted (structural) MR scans are consistent with this picture. There was no correlation of the lesion extent and scores on any behavioral assessment. Adapted from Rudebeck et al. (2013b) and Rhodes and Murray (2013).
Figure 3
Figure 3
Encoding of primary and secondary reinforcers in OFC. A) Two stimuli were paired arbitrarily with each of two different foods, equally valued by participants. Stimuli appeared sequentially for 700 ms separated by a 400-ms intertrial interval. B) Brain regions showing a decrement in BOLD response (green-blue shading) following presentation of two different stimuli that predicted the same food reward (different-stimulus, same-outcome). This measure is thought to represent primary reinforcers. C) Brain regions showing a decrement in BOLD response (red-yellow shading) following the sequential presentation of the same stimulus-reward pairing (same stimulus, same outcome). This measure is thought to represent secondary reinforcers. Z coordinates denote dorsal-ventral level. Adapted from Klein-Flugge et al. (2013).
Figure 4
Figure 4
OFC activity related to rewards delivered as instructional cues or feedback. A) Trial sequence. Trials started with the presentation of an instructional cue, either a single drop of fluid or two smaller drops. These cues signaled to the monkey whether to stay with the response from the previous trial (left or right) or switch to the alternative option. Once the monkey made a saccade to one of the two potential targets, both targets became solid white, whether correctly or incorrectly performed. Successful performance led to the delivery of additional fluid reward as feedback (reinforcement). Red type indicates sequence on example trial. B) Brain regions studied: OFC (orange on ventral view of macaque frontal lobe); frontal polar cortex (FPC, red on dorsal view of macaque frontal lobe); dorsolateral prefrontal cortex (DLPFC, green on lateral view of macaque frontal lobe). C) Percentage of neurons in OFC, FPC and DLPFC encoding the reward when delivered as an instructional cue (cue only), as feedback (feedback only) or both. Color scheme as in (B). Dashed line indicates noise/chance level for cue and feedback responses. Adapted from Tsujimoto et al. (2012).
Figure 5
Figure 5
The effect of amygdala lesions on reward-value encoding in OFC. A) Trial sequence. On each trial monkeys were sequentially presented with two stimuli (S1 and S2) associated with different amounts of reward and were instructed to choose between them. Each stimulus was associated with a different amount of fluid reward and monkeys nearly always chose the stimulus associated with the highest amount. B) Spike density and raster plots illustrating the activity of one neuron in OFC that exhibited its highest firing rate to stimuli associated with smallest amount of reward. Each dot in the raster plot indicates the time that this neuron discharged. The color of the curves and dots in the raster plot correspond to the amount of reward associated with each stimulus, as noted in the key. Inset figures show the relationship between each neuron’s firing rate and reward value, within the periods after S1 and S2 stimulus presentation, respectively. C) The proportion of OFC neurons encoding the absolute value of S2, relative value of S1 (either higher or lower than S2), or interaction between these factors after the presentation of the second stimulus. D) Effect of amygdala lesions. Left: proportion of OFC neurons preoperatively (blue/turquoise) and postoperatively (red/orange) encoding the reward value associated with S1 and S2. Right: time course of stimulus-reward value encoding. Green dots indicate significant reductions in reward encoding after amygdala lesions. Red bar: duration of S1 presentation. Purple bar: duration of S2 presentation. Adapted from Rudebeck et al. (2013a).
Figure 6
Figure 6
The effect of OFC lesions on reward-prediction errors in dopaminergic neurons of the ventral tegmental area (VTA). Mean (±SEM) firing rate (spikes / s) of reward responsive VTA neurons in sham-operated (A) and OFC lesion (B) rats following unexpected reward delivery or omission immediately (First 10 trials) and later (Last 10 trials) after a change in the reward contingencies in the task (Block switch). Without input from OFC, VTA neurons do not display the normal patterns of “prediction error” signaling. Dark solid lines represent responses to unexpected delivery of reward. Gray solid lines represent responses to unexpected omission of reward. Gray dashed lines represent baseline firing. Arrows highlight differences in the VTA neuronal responses in the first and last 10 trials after block switches in the sham-operated and lesion rats. Adapted from Takahashi et al. (2011).

References

    1. Abe H, Seo H, Lee D. The prefrontal cortex and hybrid learning during iterative competitive games. Ann N Y Acad Sci. 2011;1239:100–108. - PMC - PubMed
    1. Ahmari SE, Spellman T, Douglass NL, Kheirbek MA, Simpson HB, Deisseroth K, Gordon JA, Hen R. Repeated cortico-striatal stimulation generates persistent OCD-like behavior. Science. 2013;340:1234–1239. - PMC - PubMed
    1. Barbas H, Pandya DN. Architecture and intrinsic connections of the prefrontal cortex in the rhesus monkey. Journal of Comparative Neurology. 1989;286:353–375. - PubMed
    1. Blair RJ. Psychopathy, frustration, and reactive aggression: the role of ventromedial prefrontal cortex. Br J Psychol. 2010;101:383–399. - PubMed
    1. Boorman ED, Behrens TE, Woolrich MW, Rushworth MF. How green is the grass on the other side? Frontopolar cortex and the evidence in favor of alternative courses of action. Neuron. 2009;62:733–743. - PubMed

Publication types